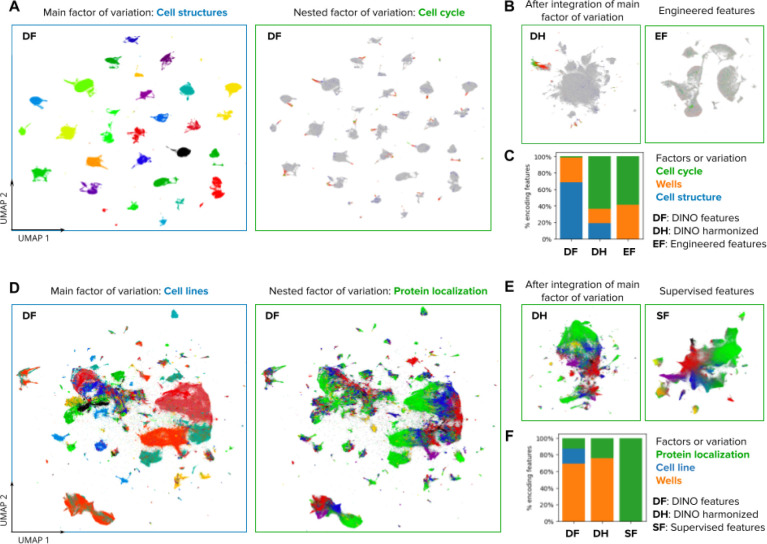
Figure 2. Visualizations of the morphology feature space automatically discovered by DINO.
A) UMAP visualization of single-cell morphology features obtained with DINO for images in the Allen Institute WTC-11 hiPSC dataset. The two UMAP plots show the same data points, with the left plot coloring points by the endogenously tagged cell structure, and the right plot coloring points by the cell-cycle stage annotation. The title and frame colors match the legend in C for factors of variation. B) UMAP visualizations of the same single-cell images in A. The left-hand side plot shows DINO features integrated with Harmony over cell lines. The right-hand side plot shows engineered features used in the original study 45. C) Stacked-bar plot displaying the fraction of features that are strongly associated with three factors of variation annotated in the WTC-11 hiPCS dataset (colors). Three feature representation strategies are compared (bars). D) UMAP visualization of single-cell morphology features obtained with DINO for images in the Human Protein Atlas dataset. The left-hand side plot shows points colored by cell line, and the right-hand side plot shows points colored by protein localization labels. The title and frame colors match the legend in F for factors of variation. E) UMAP visualizations for the same single-cell images in D. The left-hand side plot shows DINO features integrated with Harmony over cell lines. The right-hand side plot shows features obtained with a supervised CNN from a top competitor in the weakly supervised single-cell classification challenge in Kaggle 22. F) Same as in C but with factors of variation annotated in the Human Protein Atlas dataset.

