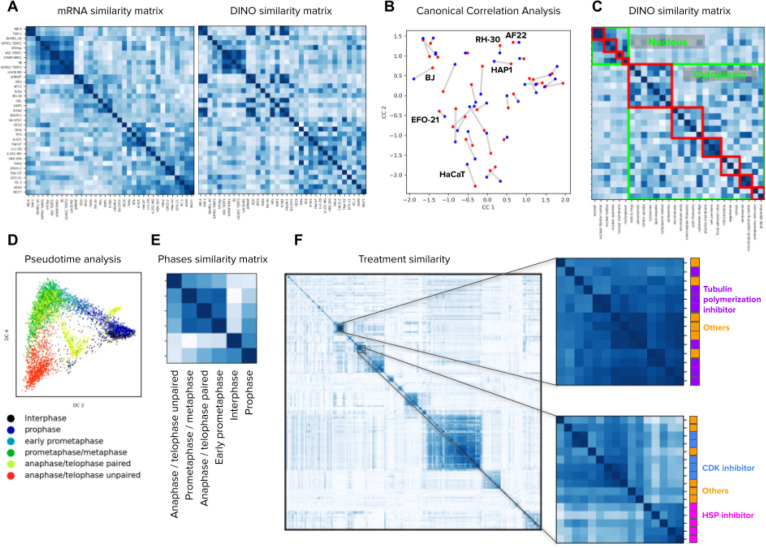
Figure 4. Image-based profiling of cellular state under different conditions.
A) Cell line profiling in the Human Protein Atlas dataset using bulk mRNA levels (left) and aggregated DINO features (right). The matrices display the cosine similarity among cell lines (rows and columns) according to mRNA levels or imaging features. The order of rows and columns in both matrices follows groups determined by hierarchical clustering of the mRNA similarity values. B) Canonical correlation analysis between mRNA readouts and DINO features aggregated by cell line in the HPA dataset (Methods). Each point in the plot corresponds to one cell line. Red points are the mRNA representation and blue points are the DINO features representation. Lines between points indicate the correct connection between the two representations for one cell line. A representative subset of the cell line points are annotated. C) Matrix of cosine similarities among DINO features aggregated by protein localization groups, with rows and columns ordered by the ground truth annotations. The clusters highlighted in green are protein localizations in the nucleus or the cytoplasm. The red clusters correspond to secondary groupings of the protein localizations, annotated by experts27 (Methods). D) Pseudotime analysis of cell cycle stages in the WTC11 dataset using the Diffusion Pseudotime (DPT) algorithm 63 on the features extracted by DINO trained on ImageNet. Points in the plot are single cells colored by cell-cycle stages. E) Matrix of cosine similarities between DINO features aggregated by cell-cycle stage groups in the WTC11 dataset. F) Matrix of cosine similarities between DINO features aggregated at the treatment-level in the LINCS Cell Painting dataset. The two matrices in the right are zoomed-in views of two groups of compounds that share similar mechanism-of-action labels, indicated by the colors and names in the right.

