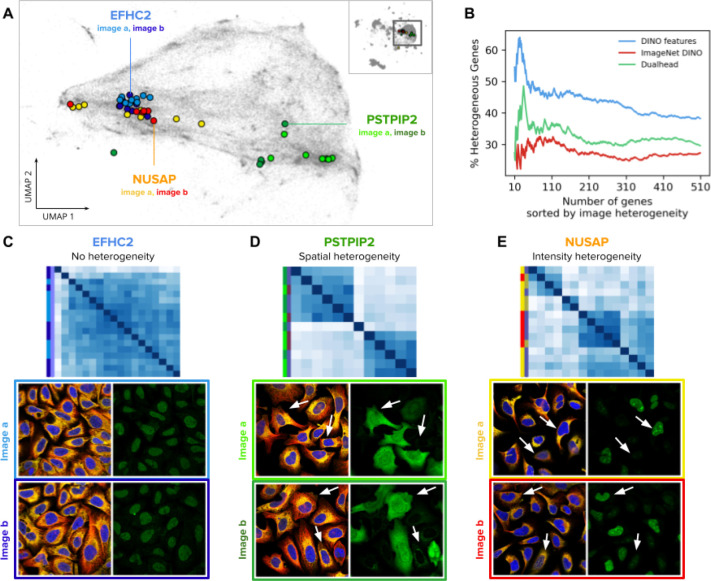
Figure 5. Single-cell heterogeneity of protein localization patterns in the Human Protein Atlas.
A) UMAP visualization of single-cell DINO features. The small map in the top-right corner shows all single cells in the HPA dataset and highlights the cluster of U2OS cells, which are presented in the main plot. Single cells from two images of the genes EFHC2 (blue), NUSAP (orange), and PSTPIP2 (green) are displayed in colors to illustrate heterogeneity patterns. Panels C, D, and E use the same color convention of the genes and the images (shades of the corresponding gene colors). B) Ability of morphology features to capture single cell heterogeneity. The x-axis represents the ranking of genes according to the variance of single-cell features in an image (Methods). The y-axis represents the proportion of genes labeled as heterogeneous according to existing annotations in the HPA website. C, D, and E are examples of heterogeneous protein localization patterns, and show cosine similarity matrices of DINO features for single cells associated with three genes: EFHC2, PSTPIP2, and NUSAP, respectively. The images below the matrices are the source of the single cells in the analysis; left images: microtubules (red), endoplasmic reticulum (yellow), and nucleus (blue); right images: protein channel - arrows indicate cells exhibiting different protein expression patterns according to the type of heterogeneity. The color labels follow the conventions in A.

