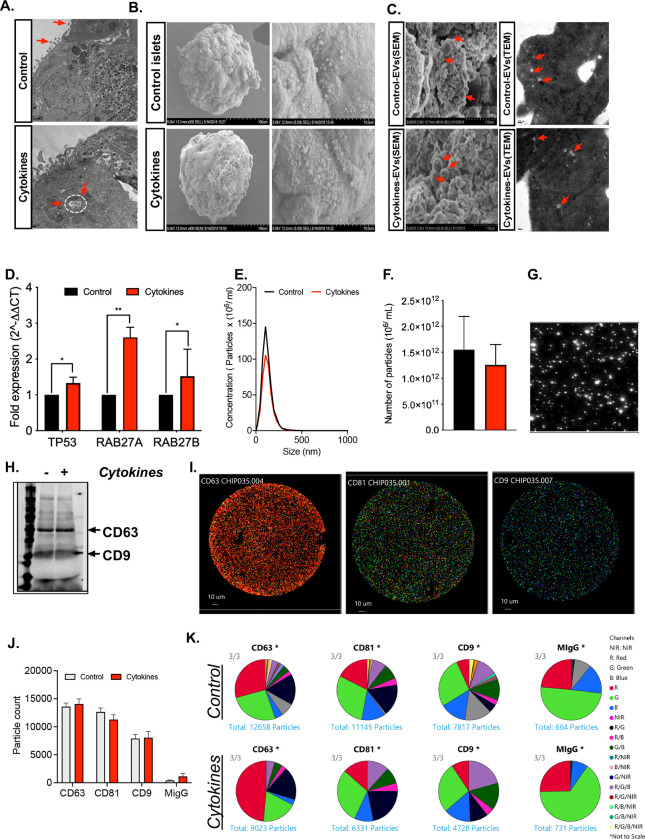
Figure 2: Characterization of isolated EVs.
Human islets were treated with or without 50 U/mL IL-1β and 1000 U/mL IFN-γ for 24 hours. (A) Islets were then subjected to TEM analysis to identify the presence of EVs over the islet plasma membrane and multivesicular bodies (MVs) inside the cytoplasmic region of pancreatic β cells, indicated by red arrows. (B) SEM images of human islets show the presence of EVs over the islet plasma membrane (C) Representative SEM and TEM images of isolated EVs from control and cytokine-treated islet culture supernatant. (D) qRT-PCR analysis of markers involved in EV biogenesis in control and cytokine-treated islets (*p<0.05, **p<0.01. n = 6). (E-F) nanoparticle tracking analysis (NTA) showing size distribution graphs for isolated EVs from control (black line) and cytokine-treated (red line) islets. (G) Bright field images from NTA. (H) Immunoblot analysis for CD63 and CD9 from isolated EVs. (I) Images of Exoview showing the presence of EVs captured using CD63, CD81, CD9 and mouse IgG(MIgG) was used as an negative control. (J) Quantification of EV particles and (K) co-localization of tetraspanin marker with each other markers from control and cytokine treated human islet culture supernatant. (n = 3).

