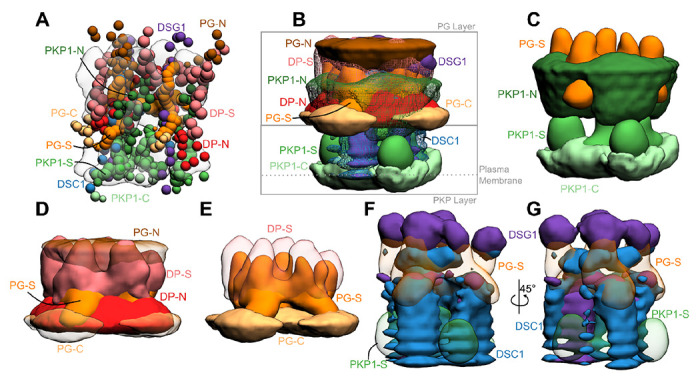
Figure 3. Integrative structure of the desmosomal ODP.

A) The cluster center bead model for the major structural cluster with the cryo-tomogram (EMD-1703) superimposed in translucent gray. B) Localization densities of the major cluster. The densities are at a cutoff of approximately 15% for PKP1-C, PKP1-S, PG-S, DP-S, Dsc1, Dsg1 and around 30% for disordered termini regions (PKP1-N, PG-N, DP-N, PG-C). C) Localization densities for PKP1 layer (PG-S density is shown for reference). D) Localization densities for PG-layer. E) The densities for PG-S and DP-S with PG-C as a reference. F-G) Localization densities for the cadherins. Panel G is a rotated view of Panel F. See also Fig. S2–S4.
