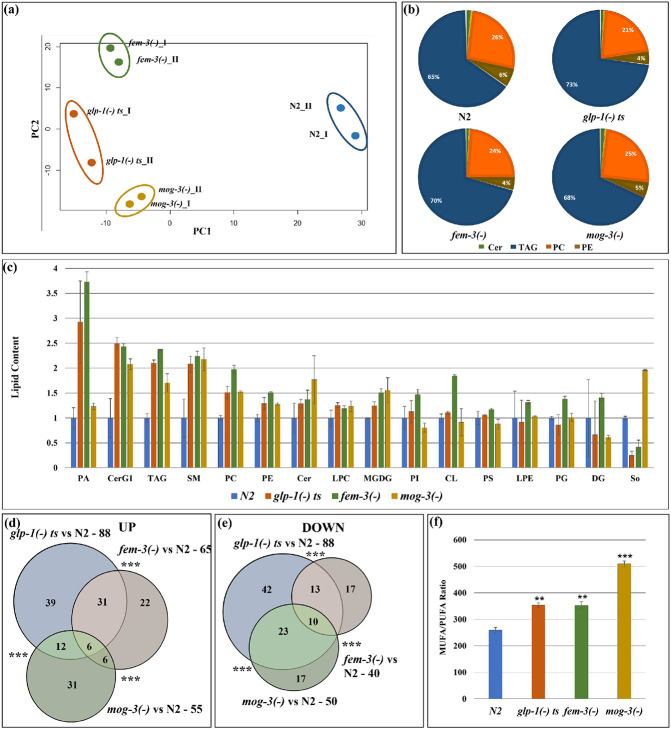
Fig. 2: Lipidomic analyses revealed that the different sterile mutant strains share similar but also distinct lipid profiles.
(a). PCA analysis of the two replicates of wild-type N2, glp-1(e2141), fem-3(e1996) and mog-3(q74) showed that the mutants are clearly separated from wild-type N2. Each dot indicates one replicate. PCA plot is generated using EdgeR.
(b). Relative distribution of different lipids in N2, glp-1(e2141), fem-3(e1996) and mog-3(q74) worms showed that the major portion of the lipidome was comprised of TAG, PC and PE and Sphingolipids, especially ceramides.
(c). Relative levels of different lipid groups in N2, glp-1(e2141), fem-3(e1996) and mog-3(q74) worms. The lipid groups were categorized by pooling the normalized counts of the lipid molecules in each of the lipid groups. Y-axis represents the average lipid content of the two replicates in each genotype normalized to wild-type N2. PA – Phosphatidic acid, CerG1 – Glucosylceramide, TAG- Triacylglyceride, SM- Sphingomyeline, PC- Phosphatidylcholine, PE- Phosphatidylethanolamine, Cer- Ceramide, LPC- Lysophosphatidylcholine, MGDG- Monogalactosyldiacylglycerol, PI- Phosphatidylinositol, CL- Cardiolipin, PS- Phosphatidylserine, LPE- Lysophosphatidylethanolamine, PG- Phosphatidylglycerol, DG- Diacylglycerol, So- Sphingosine.
(d, e). Venn diagram showing upregulated lipid molecules (d) and downregulated lipid molecules (e) in glp-1(e2141), fem-3(e1996) and mog-3(q74) vs N2. Venn diagrams were generated using edgeR. A detailed list of lipid molecules is shown in Supplementary Table 3.
(f). Ratio of total MUFA (mono-unsaturated fatty acids) and PUFA (poly-unsaturated fatty acids) in wild-type N2, glp-1(e2141), fem-3(e1996) and mog-3(q74). The ratios were significantly higher in the sterile mutants compared to wild-type irrespective of their lifespan phenotypes.

