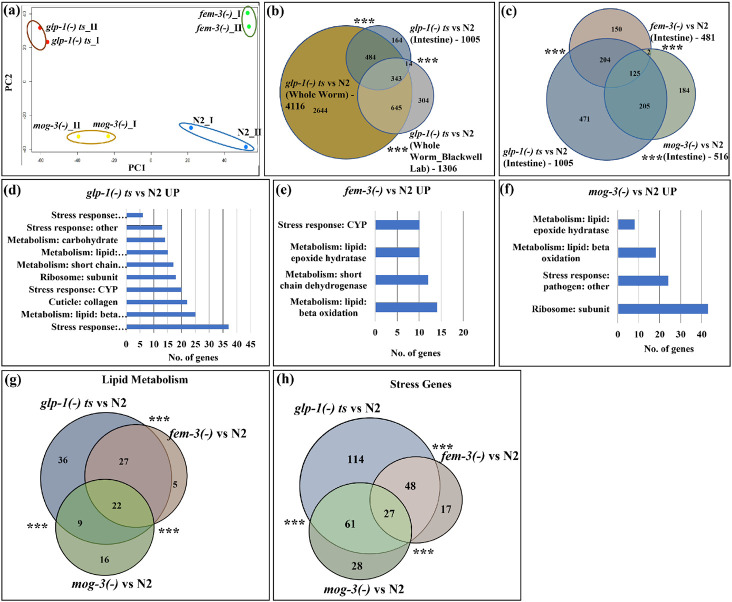
Fig. 3: Intestinal-specific transcriptomic analyses revealed that the sterile mutants showed significant upregulation of immunity and fat metabolism genes.
(a). PCA analysis of the RNA-seq data for two replicates of N2, glp-1(e2141), fem-3(e1996) and mog-3(q74) worms showed that the long-lived glp-1(e2141) and fem-3(e1996) worms are clearly separated from wild-type N2 and short-lived mog-3(−) worms. Each dot indicates one replicate. PCA plot is generated using EdgeR. Dissected intestines at the young adult stage were used to generate the RNA-seq data.
(b). Venn diagram showed a significant overlap among the upregulated genes in glp-1(e2141) worms (relative to N2) in intestine-only, in whole-worm, and in a published data set21. The List of genes and overlaps are shown in Supplementary Table 4.
(c). Venn diagram showing the significant overlaps between the upregulated genes in glp-1(e2141), fem-3(e1996) and mog-3(q74), relative to N2. The glp-1(−) mutant showed the greatest gene expression changes (1,005 upregulated genes). Between fem-3(−) and mog-3(−) mutants, only 125 genes were commonly changed (out of the 481 upregulated genes in fem-3(−) and 516 upregulated genes in mog-3(−)). The changed genes in fem-3(−) and mog-3(−) mutants were a subset of the glp-1(−) changes (329 of 481 and 330 of 516 in fem-3(−) and mog-3(−), respectively). The gene lists and overlaps are shown in Supplementary Table 8.
(d, e, f). Gene ontology (GO) terms showed that the metabolism and stress response genes are among the common GO terms that are over-represented in the upregulated genes in glp-1(e2141) (d), fem-3(e1996) (e), and mog-3(q74) (f), relative to N2. Detailed lists of the GO terms are shown in Supplementary Table 9.
(g, h). Venn diagram showed the significant overlaps between the upregulated lipid metabolism genes (22) (g)) and stress response genes (27) (h) in glp-1(e2141), fem-3(e1996) and mog-3(q74), relative to N2. Venn diagrams were generated using edgeR . ***p < 0.001.

