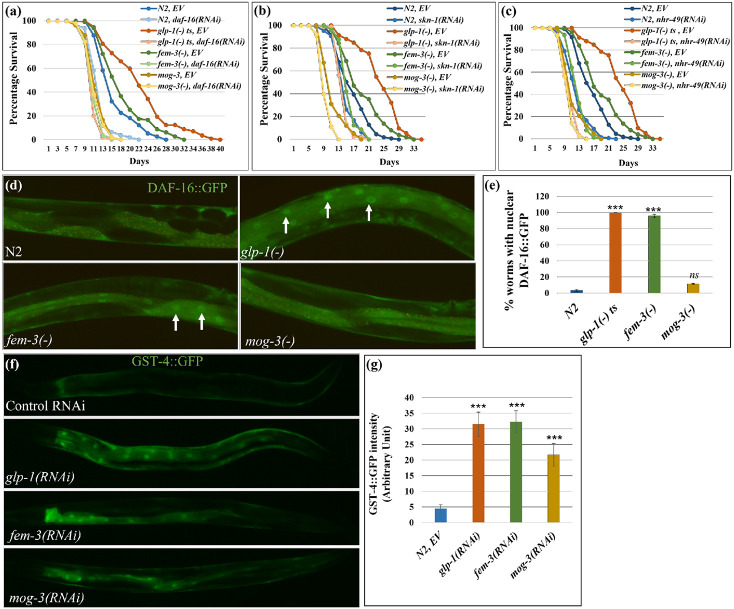
Fig. 5: The lifespans of different sterile mutants were dependent on distinct genetic pathways.
(a-c) Survival curves showing the lifespans of wild-type N2, glp-1(e2141), fem-3(e1996), and mog-3(q74) worms upon daf-16 RNAi (a), nhr-49 RNAi (b), and skn-1 RNAi (c) (lifespan data and statistics are shown in Supplementary Table 16). Lifespan assays were done using at least 90 worms for each genotype per replicate (N=2).
(d, e). Representative images (d) and quantification (e) showed that nuclear localization of daf-16::gfp is elevated in glp-1(RNAi) and fem-3(RNAi) worms but not in mog-3(RNAi) worms. Y-axis represents mean GFP intensity of two replicates of each genotype with at least 10 worms per replicate. ***p < 0.001, ns - not significant. Arrowheads mark nuclear DAF-16::GFP. (f, g). Representative images (f) and their quantification (g) showed that gst-4::gfp is elevated in glp-1(RNAi), fem-3(RNAi) and mog-3(RNAi) worms. Y-axis represents mean GFP intensity of two replicates for each genotype with at least 10 worm per replicate. ***p < 0.001.

