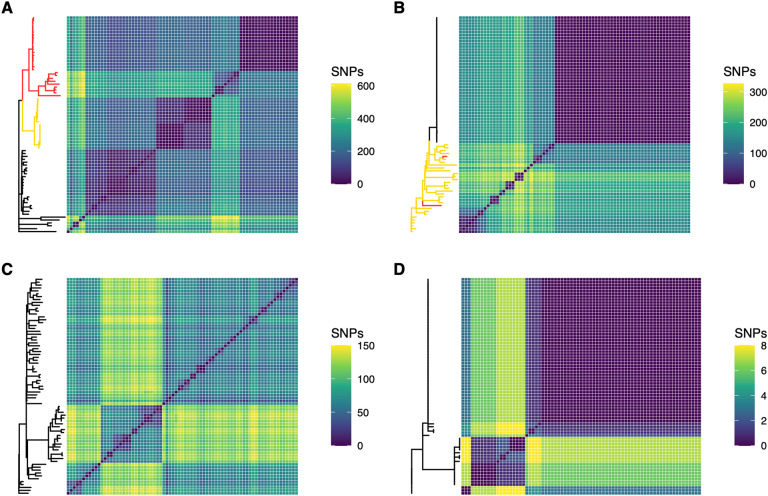
Figure 2. Genomic diversity as measured by core genome SNPs varies greatly from one population to another.
Populations are presented in order of decreasing genomic diversity: Patient 1 (A), Patient 2 (B), Patient 3 (C), and Patient 4 (D). Isolates with one DNA mismatch repair mutation are highlighted in yellow on phylogenies. Isolates with two DNA mismatch repair mutations are highlighted in red.

