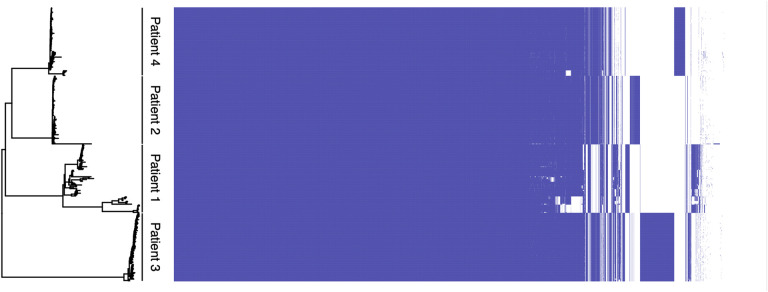
Figure 5. Patient 1 has a larger proportion of variable genes than Patients 2, 3, and 4, as displayed by the aggregated genomes of the 300-isolate dataset.
Phylogeny is given on the left, and the aggregated genome matrix on the right. Each tile on the x-axis of the aggregated genome matrix indicates a gene family, where a blue tile indicates presence of that gene family at ≥90% BlastP sequence identity in a sample, and a white tile indicates absence.

