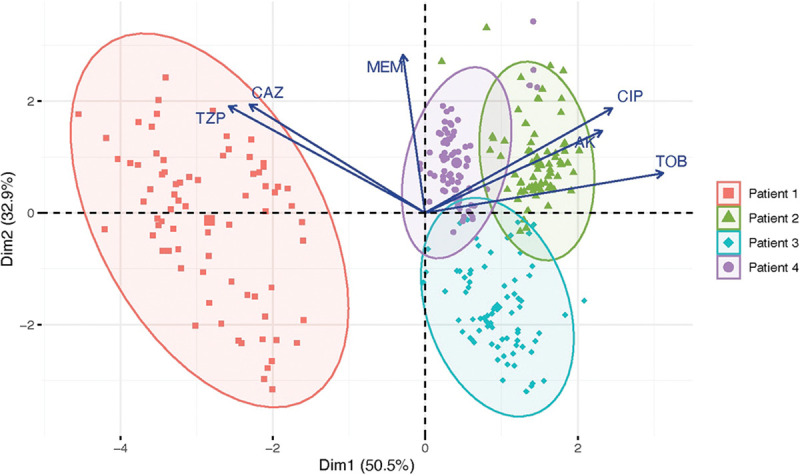
Figure 2.

Principal components analysis plot of antimicrobial sensitivities shows that isolates cluster by patient. 50.5% of the variance in antimicrobial sensitivities is demonstrated by dimension 1, and 32.9% of the variance is demonstrated by dimension 2. Vectors demonstrate to what degree each variable (i.e., antimicrobial) influences the principal components.
