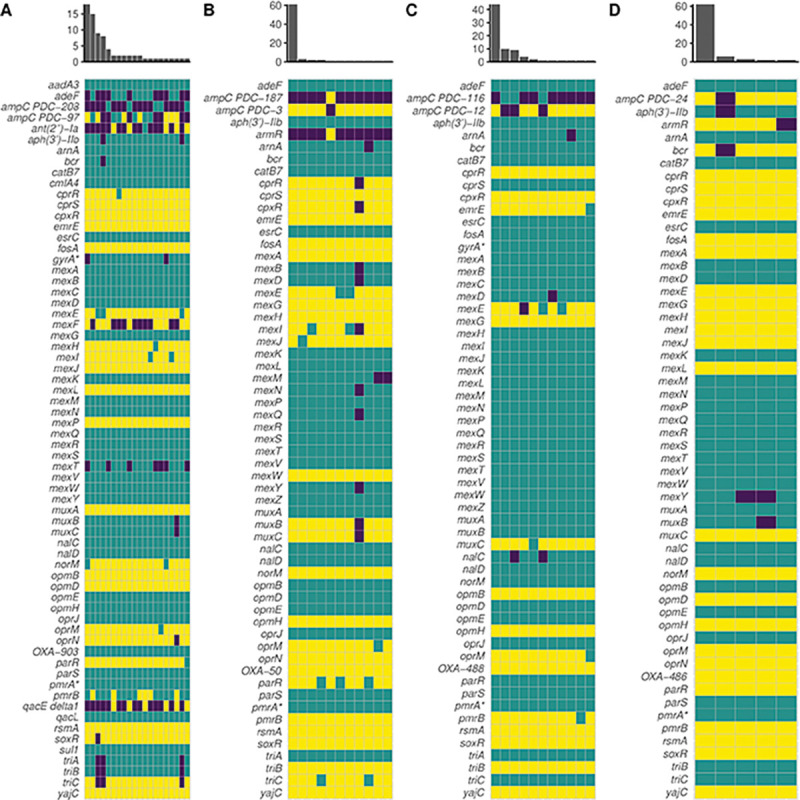
Figure 4.

Visualized resistomes of Patients 1 (A), 2 (B), 3 (C), and 4 (D) as predicted by the Comprehensive Antibiotic Resistance Database Resistance Gene Identifier (CARD RGI) demonstrate decreasing levels of resistome diversity. Yellow indicates a perfect hit to the database, teal indicates a strict hit, and purple indicates no hit (or loose hit in some cases). X-axis of the histogram indicates the number of unique resistome profiles in the population, and y-axis indicates the number of isolates in the population that share a unique resistome profile. An asterisk (*) indicates a gene with resistance conferred by a mutation (i.e. CARD RGI protein variant model).
