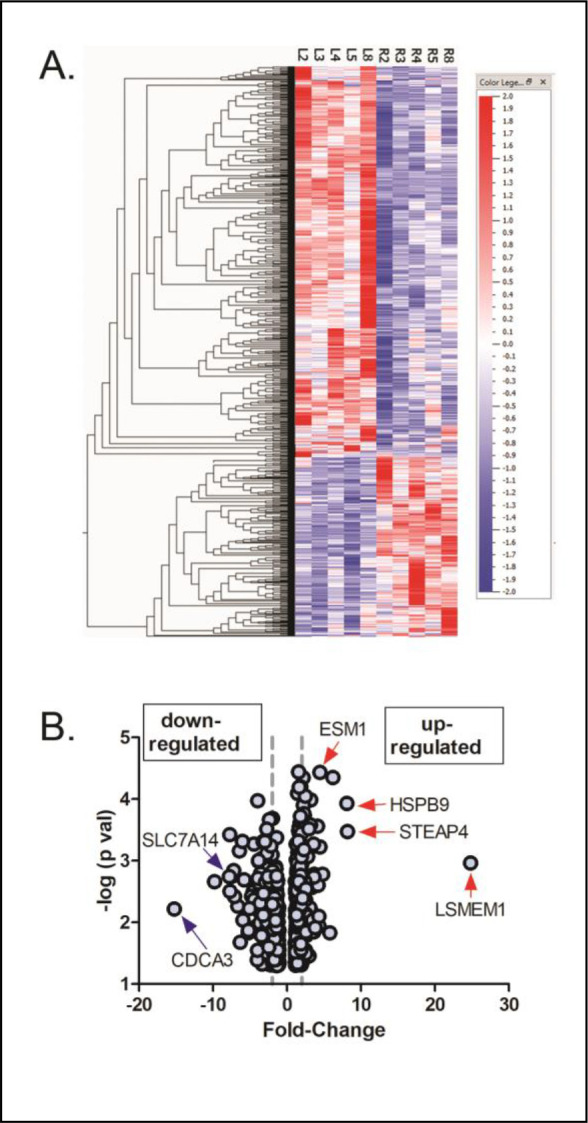
Figure 2.

Differentially expressed genes in chick choroids in response to 1.5 mM PAPA-NONOate. (A) Heat map showing signal intensities of differentially expressed genes in control (L2, L3, L4, L5, and L8) and PAPA-NONOate-treated (R2, R3, R4, R5, and R8) choroids. (B) Volcano plot of differentially expressed genes in response to PAPA-NONOate treatment (p < 0.05, paired t-test). The x-axis represents the fold change values, and the y-axis represents the negative log of the significance level (paired t-test). The left and right dashed vertical lines indicate positions for 2 fold down regulated genes and 2 fold up regulated genes, respectively. Genes indicated with blue arrows (down-regulated) and red arrows (up-regulated) were confirmed with reverse transcription qPCR.
