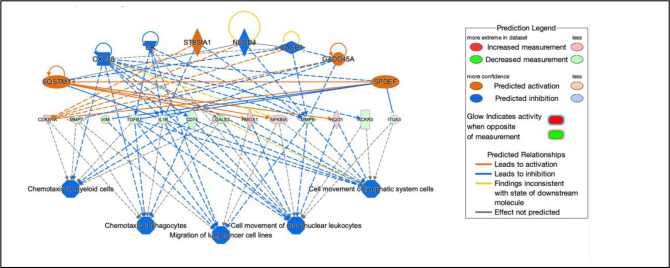
Figure 5.
Network diagram representing the highest ranked regulatory effect pathway of PAPA-NONOate on choroidal gene expression based on the consistency score. Upregulated genes are labeled in red or pink, while downregulated genes are labeled in green. The saturation of color is correlated with the fold change of the gene (high saturation means high fold change and low saturation means low fold change). Solid lines indicate direct connections, while dotted lines indicate indirect connections (circular arrows indicate autocrine influence). Triangles represent kinases, horizontal diamonds represent peptidases, dashed squares represent growth factors, squares represent cytokines, vertical ovals represent transmembrane receptors, horizontal ovals represent transcription regulators, vertical diamonds represent enzymes, rectangles represent G-protein coupled receptors, and circles represent “other”. Treatment of choroids with PAPA-NONOate is predicted to inhibit pathways involved in chemotaxis of myeloid cells and phagocytes, migration of lung cancer cell lines, and cell movement of mononuclear leukocytes and lymphatic system cells.

