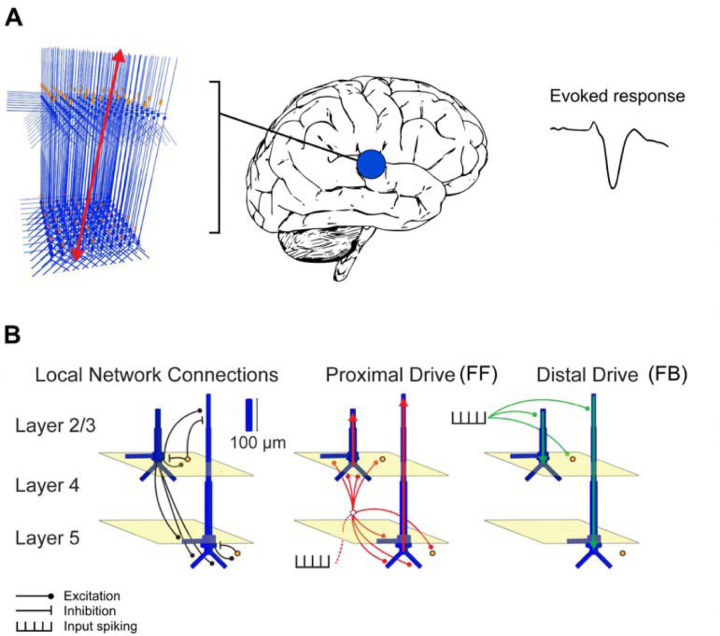
Figure 1.
Schematic illustration of the HNN model. (A) A network of neurons in a local cortical area generates an evoked response. (B) Local network structure with pyramidal cells (blue) and interneurons (orange). Excitatory and inhibitory coupling is indicated by a black circle and bar, respectively. The network is activated by proximal (red) and distal (green) drives by input spike trains. Modified from Neymotin et al. (2020).

