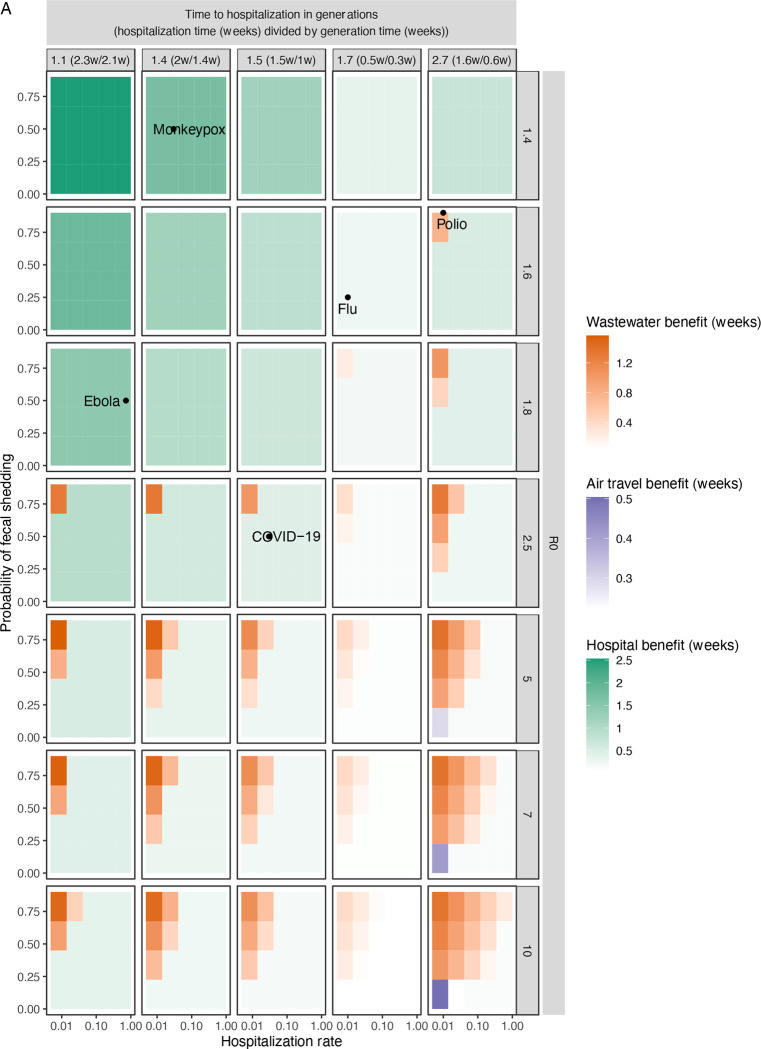
Fig. 3. Comparison of detection systems across the space of possible diseases of varying epidemiological parameters.
(A) Average weeks gained over status quo detection by the proposed detection systems across the epidemiological space of possible diseases. Within each panel, each uniformly colored cell corresponds to a specific disease with the hospitalization rate and probability of fecal shedding indicated on the x- and y-axes, as well as the R0 and time to hospitalization (generations) indicated by the panel row and column. The cell has a hue corresponding to the detection system that detects the disease the earliest (hospital (teal), wastewater (orange) and air travel (purple)) and an intensity corresponding to the number of weeks gained by the earliest system over status quo detection. Times are calculated by the derived mathematical approximation in a 650,000-person catchment.

