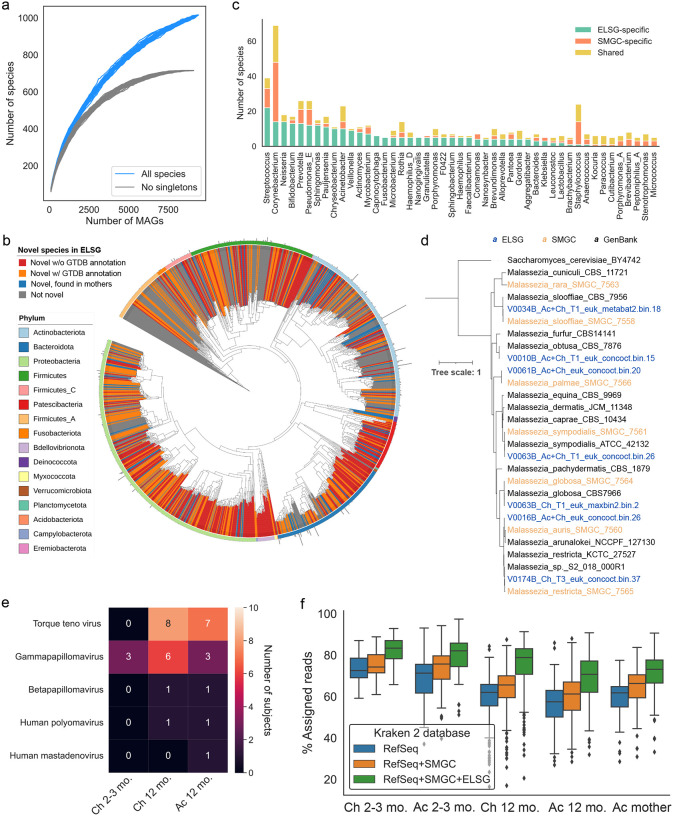
Figure 2. Expansion of species diversity in skin microbiome.
a. Rarefaction analysis of the number of species as a function of the number of nonredundant genomes. Curves are depicted both for all the ELSG species and after excluding singleton species (represented by only one genome).
b. Phylogenetic tree of the 1,029 representative bacterial MAGs in the ELSG catalog. Clades are colored by GTDB phylum annotation (outer ring) and whether these are novel species (inner shades). Bar graphs in the outermost layer indicate the number of nonredundant genomes within each species-level cluster.
c. Comparison of species diversity between the ELSG catalog and the SMGC. Species-level clusters were binned into the genus level in the bar graphs, ordered by a decreasing number of ELSG-specific species.
d. Phylogenetic tree of the Malassezia genomes from the ELSG and the SMGC together with GenBank reference genomes with Saccharomyces cerevisiae as the outgroup.
e. Number of infant samples harboring eukaryotic viruses included in the ELSG catalog.
f. Proportion of metagenomic reads from skin samples classified with Kraken 2 databases based upon RefSeq, augmented by the SMGC and the ELSG. The boxes represent the interquartile range, and the whiskers indicate the lowest and highest values within 1.5 times the interquartile range.

