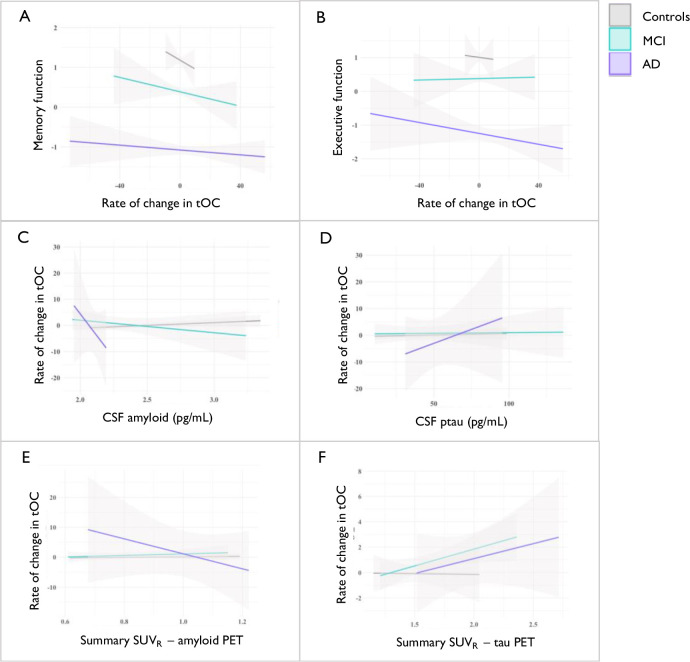
Fig 5: The relationship between cognitive function and CSF markers with the rate of change in tOC.
Fitted lines are from a linear regression model per diagnostic group for (A) Memory function, (B) Executive function, (C) CSF Aβ 1–42, and (D) CSF phospho-tau (E) Summary SUVR amyloid PET (F) Summary SUVR tau PET.

