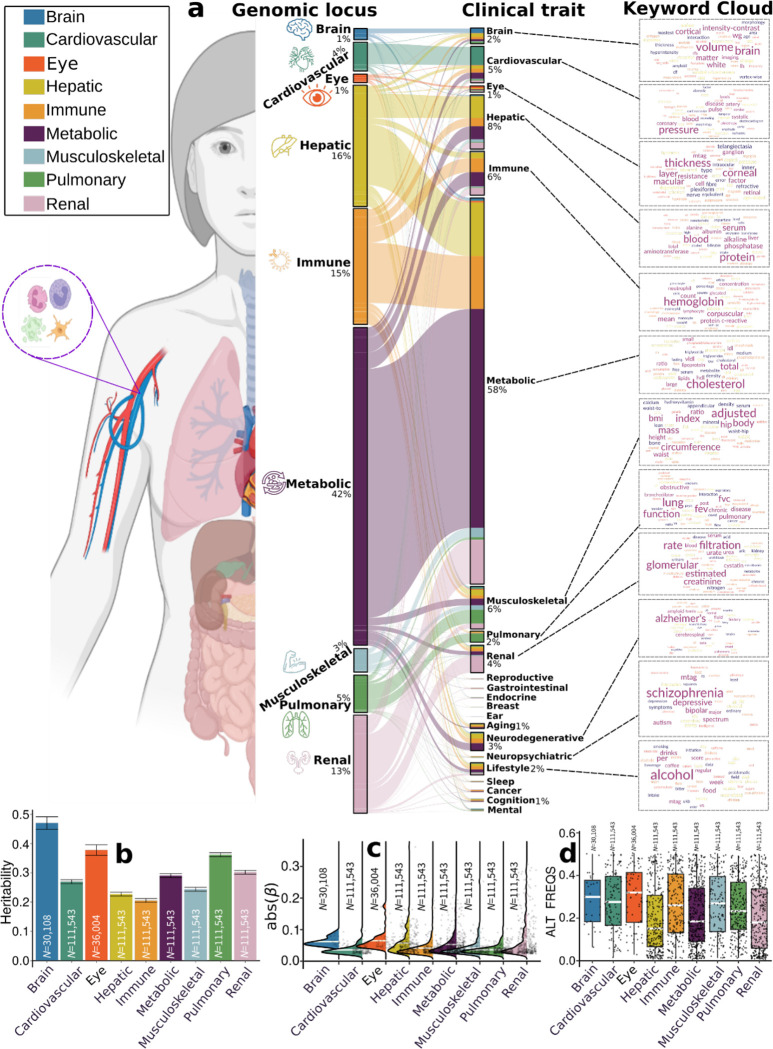
Figure 2: Phenome-wide associations of the identified genomic loci and SNP-wide heritability estimates of the nine biological age gap.
a) Phenome-wide association query of the identified genomic loci in the EMBL-EBI GWAS Catalog (query date: 24th April 2023, via FUMA version: v1.5.4) showed an organ-specific and inter-organ landscape. By examining the independent significant SNPs considering linkage disequilibrium (Method 3d) within each genomic locus, we linked them to various clinical traits. These traits were categorized into high-level groups encompassing different organ systems, neurodegenerative and neuropsychiatric disorders, and lifestyle factors. To visually represent the findings, we generated keyword cloud plots based on the frequency of these clinical traits within each BAG. The length of each rectangle block indicates the number of associations concerning the genomic loci in our analysis and clinical traits in the literature. The individual disease traits were categorized within their respective organ systems. However, this categorization doesn’t imply that the sum of these diseases exclusively represents the entirety of the organ system or that these diseases are solely associated with one specific organ system. Additional searches on alternative public GWAS platforms, such as the GWAS Atlas, are provided in Supplementary eText 2. b) Brain BAG is more heritable than other organ systems using GCTA24. c) Brain BAG showed larger effect sizes of the independent significant SNPs than other organ systems. The kernel density estimate plot shows the distribution of the effect sizes (i.e., the magnitude of the linear regression β coefficients) in the nine GWAS. The white horizontal lines represent the mean effect sizes. d) The distribution of the alternative allele frequency (effect allele) for the nine BAGs. Of note, only independent significant SNPs were shown for each BAG in Figures c-d. All results in Figures b-d used the original full sample sizes of the nine BAGs; the brain, eye, and other body organ BAGs have different sample sizes. Error bars represent the standard error of the estimated parameters. Results for Figure b-d using the down-sampled sample sizes (N=30,108 of the brain BAG) are shown in Supplementary eFigure 12. ALT FREQS: allele frequency of the alternative (effective) allele.

