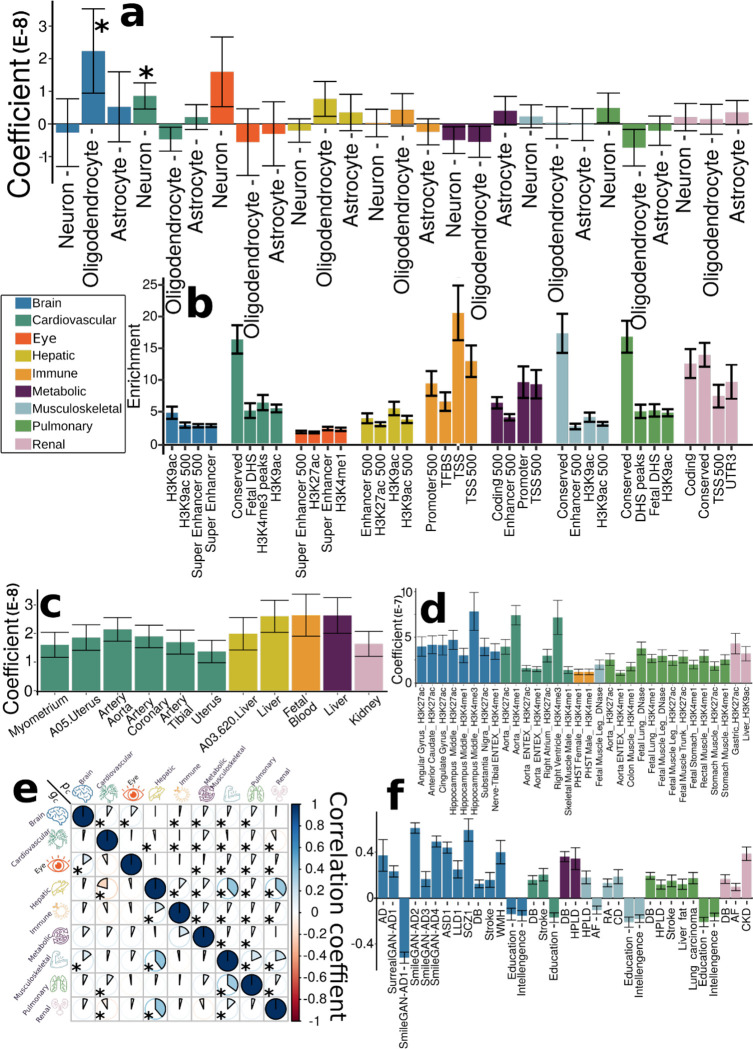
Figure 5: Partitioned heritability enrichment and genetic correlation of the nine biological age gaps.
a) Cell type-specific partitioned heritability estimates for neurons, oligodendrocytes, and astrocytes. b) Partitioned heritability estimates for the general 53 functional categories. For visualization purposes, we only showed the four categories with the highest significant estimates for each BAG. The label for 500 denotes a 500-bp window around each of the 24 main annotations in the full baseline model, which prevents a biased estimate inflated by heritability in flanking regions52. c) Tissue-specific partitioned heritability estimates using gene sets from multi-tissue gene expression data. d) Tissue and chromatin-specific partitioned heritability estimates using multi-tissue chromatin data. e) Cheverud’s Conjecture: the genetic correlation between two BAGs (gc, lower triangle) mirrors their phenotypic correlation (pc, upper triangle). f) Genetic correlations between the nine BAGs and 41 clinical traits, including chronic diseases and their subtypes involving multiple human organ systems, education, intelligence, and reaction time. The symbol * denotes Bonferroni-corrected significance; the absence of * indicates all results remain significant after correction. The standard error of the estimated parameters is presented using error bars. Abbreviation: AD: Alzheimer’s disease; ASD: autism spectrum disorder; LLD: late-life depression; SCZ: schizophrenia; DB: type 2 diabetes; WMH: white matter hyperintensity; HPLD: hyperlipidemia; AF: atrial fibrillation; RA: rheumatoid arthritis; CD: Crohn’s disease; CKD: chronic kidney disease.

