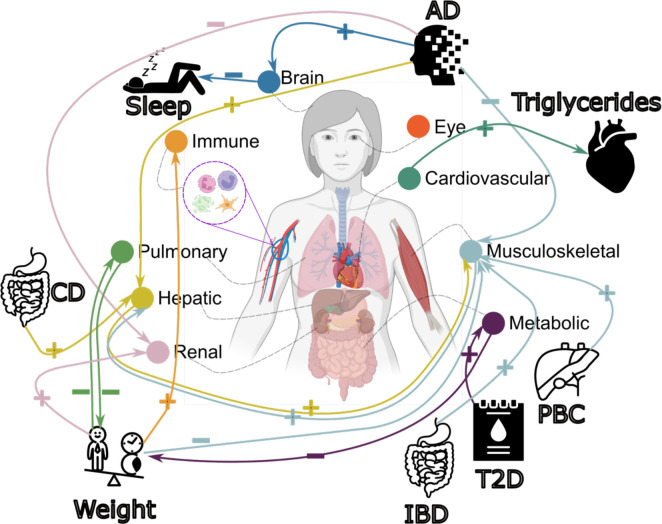
Figure 6: Causal multi-organ network between the 9 biological age gaps and 17 clinical traits of chronic diseases, lifestyle factors, and cognition.
We conducted two sets of Mendelian randomization analyses. Firstly, we examined the causal relationships between each pair of BAGs, excluding overlapping populations. Secondly, we investigated the causal associations between the 9 BAGs and the 17 unbiasedly selected clinical traits. Bi-directional analyses, including forward and inverse analyses on the exposure and outcome variables, were performed in all experiments. Significant tests were adjusted for multiple comparisons using the Bonferroni correction. Each colored arrow represents a potential causal effect connecting the exposure variable to the outcome variable. The symbol “+” denotes an OR larger than 1, while “−” represents an OR smaller than 1. Detailed OR and 95%CI information can be found in Supplementary eFigure 38 and eFile 19–20. It’s crucial to approach the interpretation of these potential causal relationships with caution despite our thorough efforts in conducting multiple sensitivity checks to assess any potential violations of underlying assumptions. Abbreviation: AD: Alzheimer’s disease; T2D: type 2 diabetes; PBC: primary biliary cholangitis; CD: Crohn’s disease; IBD: inflammatory bowel disease; CI: confidence interval; OR: odds ratio.

