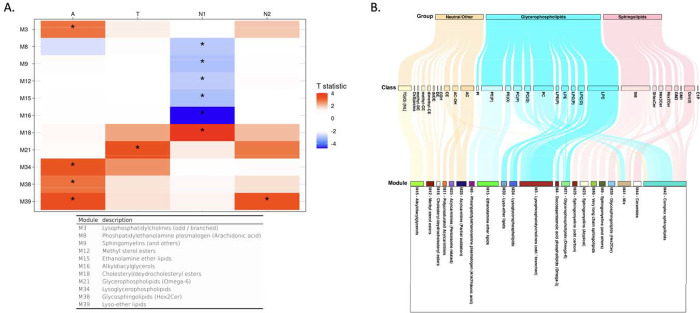
Figure 3.
Lipid network module levels: association results of lipid network modules with A/T/N biomarkers at baseline. (A) The table showed association results between lipid network modules and A/T/N biomarkers at baseline. Asterisks indicate significant associations after FDR correction. Red colors indicate that higher ME values of the red-colored module were associated with worse AD biomarkers, and blue colors indicate that lower ME values of the blue-colored module were significantly associated with worse AD biomarkers. T statistic values were derived from linear regression analysis and positive T statistic values indicate that higher ME values are associated with worse AD biomarkers. (B) A Sankey diagram was used to visualize clustering of lipid species in the lipid network modules identified as significantly associated with cross-sectional or longitudinal changes of A/T/N biomarkers.

