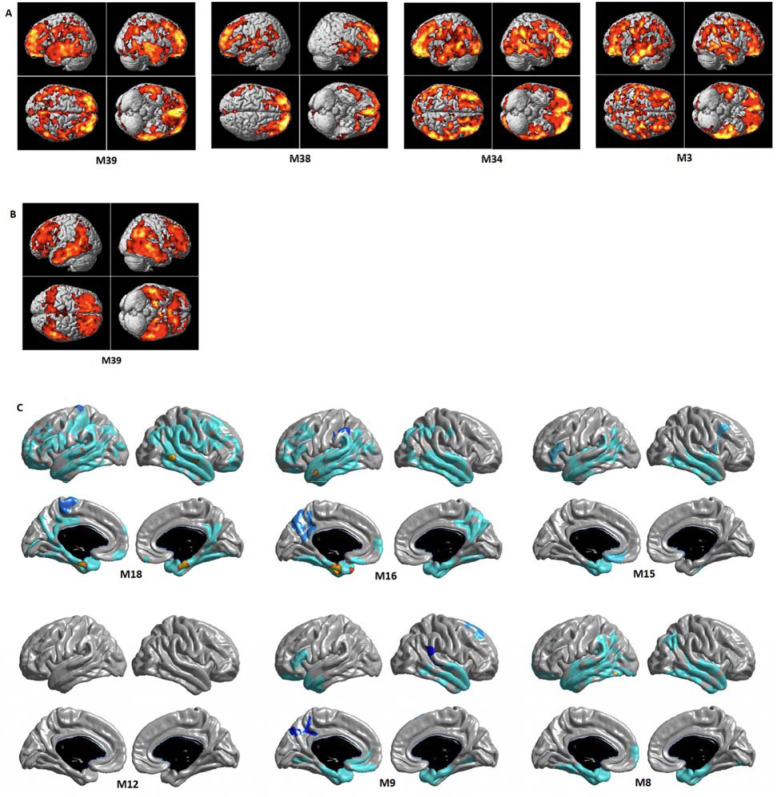
Figure 4.
Detailed whole brain association analysis for lipid correlation network module levels: association results of network modules with neuroimaging (PET and MRI) biomarkers for AD at baseline for (A) brain amyloid deposition using Amyloid PET scans, (B) brain glucose metabolism using FDG PET scans, and (C) brain structural atrophy using MRI scans. In a voxel-based whole brain analysis (A) and (B), colored regions represented significant associations (cluster wise threshold of FDR-corrected p < 0.05). In a surface-based whole brain analysis (C), statistical maps were thresholded using a random field theory for a multiple testing adjustment to a corrected significance level of 0.05. The p-value for clusters indicates significant p values with the lightest blue color.

