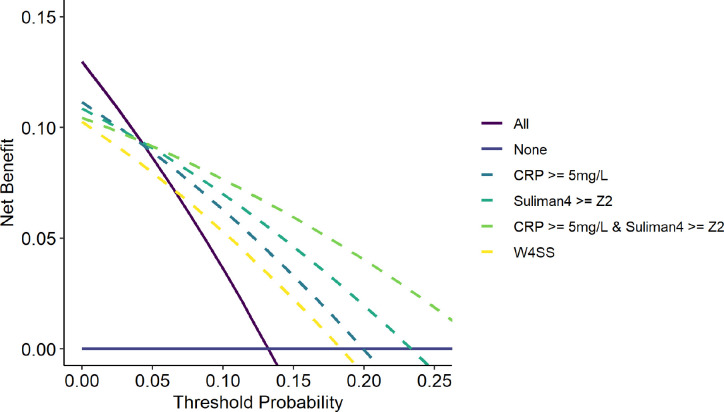
Figure 3. Decision curve analysis for alternative triage strategies to trigger confirmatory investigations for TB.
Net benefit (true positive rate - false positive rate weighted by cost:benefit ratio) for investigate all and investigate none approaches across the range of threshold probabilities that a service may use to trigger confirmatory investigations for TB is compared to that of decisions to investigate triggered by each of triage strategies indicated: CRP (≥5 and ≥10mg/L), Suliman4 (Z2), symptoms (W4SS) and using an exploratory approach of CRP>=5 and Suliman4 >=Z2.

