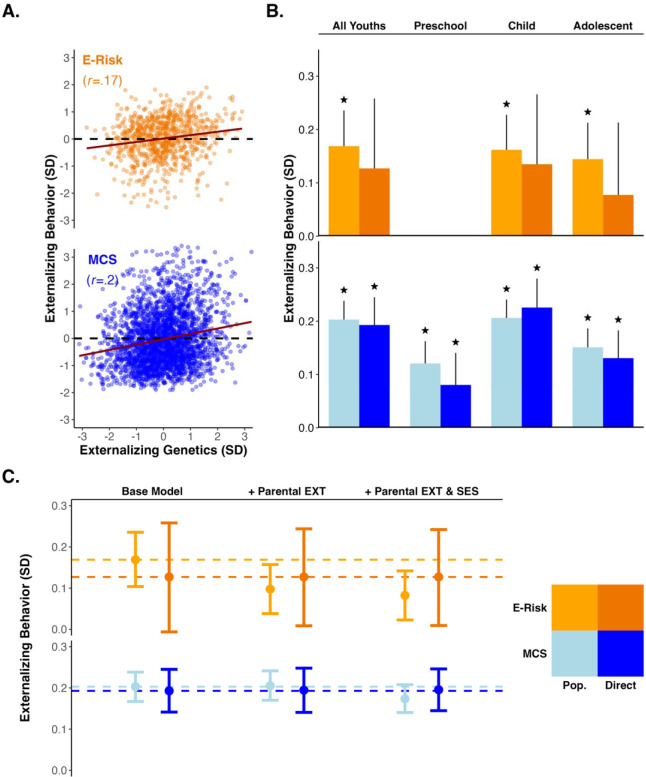
Figure 2.
Panel A. Scatter plots of the genotypic and phenotypic externalizing measures in the E-Risk (orange) and MCS (blue) cohorts (trendline=slope of correlation). Panel B. Bar plot of the population (lighter orange/blue) and direct genetic effects (darker orange/blue) for the E-Risk and MCS cohorts. Columns include bias-adjusted bootstrapped 95% confidence intervals (reps=1000); (null: ). Panel C. Point estimates and bias adjusted bootstrapped 95% confidence intervals (reps=1000) across three models of progressive covariate adjustment in the E-Risk and MCS cohorts. The “Base Model” includes no additional covariates, the next model includes parental externalizing behavior, and the final model includes parental externalizing behavior and parental socioeconomic status. The measure of externalizing behavior was derived by pooling observations across all epochs. Dashed horizontal lines provide references for the effect sizes observed in the “Base Model”.

