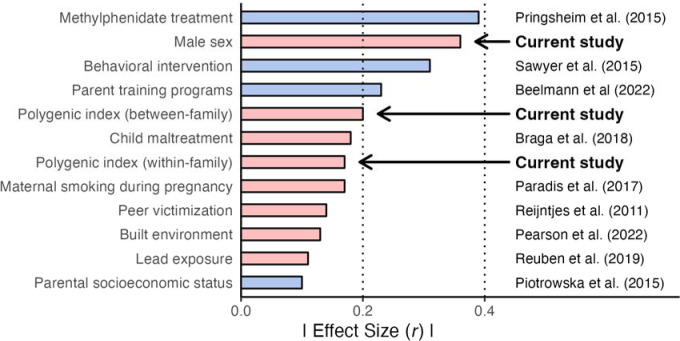
Figure 3. Comparison of effect sizes (interpretable on the correlation scale) of predictors observed in the current study, and those from the literature, on externalizing behavior.
. Colors represent the polarity of the effect size reported in the original article, with negative values (blue) representing reductions in externalizing behavior and positive values (red) representing increases. Between-/within-family estimates for the externalizing PGI were taken from the MCS models with data pooled across epochs. Estimate for male sex is the main effect of sex from the multiplicative interaction models in the MCS using data pooled across epochs. Note: effect coding was used for sex, making the estimate for sex interpretable as the true main effect, not the marginal effect.

