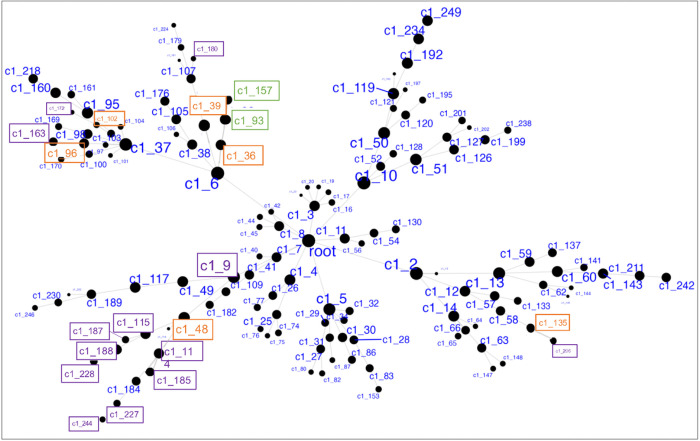
Figure 1.
Hierarchical network structure of clusters via MEGENA. Highlighted in purple are 5 un-nested clusters (and their child clusters, total 18 clusters) showing significant differences in expression between High-SI and No-SI. In green are 2 nested clusters showing significant association with suicidal ideation severity among High SI. In orange are the 6 parent clusters.

