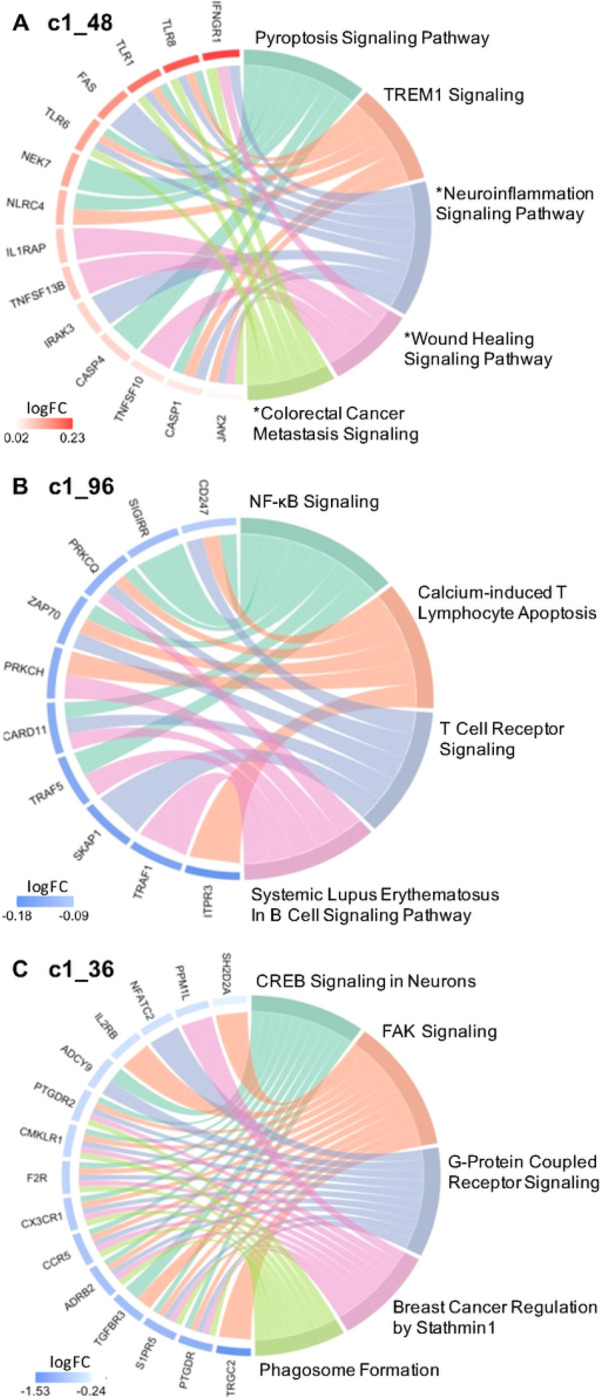
Figure 4.

Circos plots show relationships between genes (left side) and significant IPA canonical pathways (right side). Significant IPA canonical pathways are identified for 2 SI group associated clusters (Panel A and B) and 1 suicide severity associated cluster (Panel C), based on |Z| > 2 and BH p < 0.1. Pathways marked with an asterisk (*) indicate a p-value less than uncorrected p < 0.05 but BH p >0.1. log FC = log 2 fold change expression.
