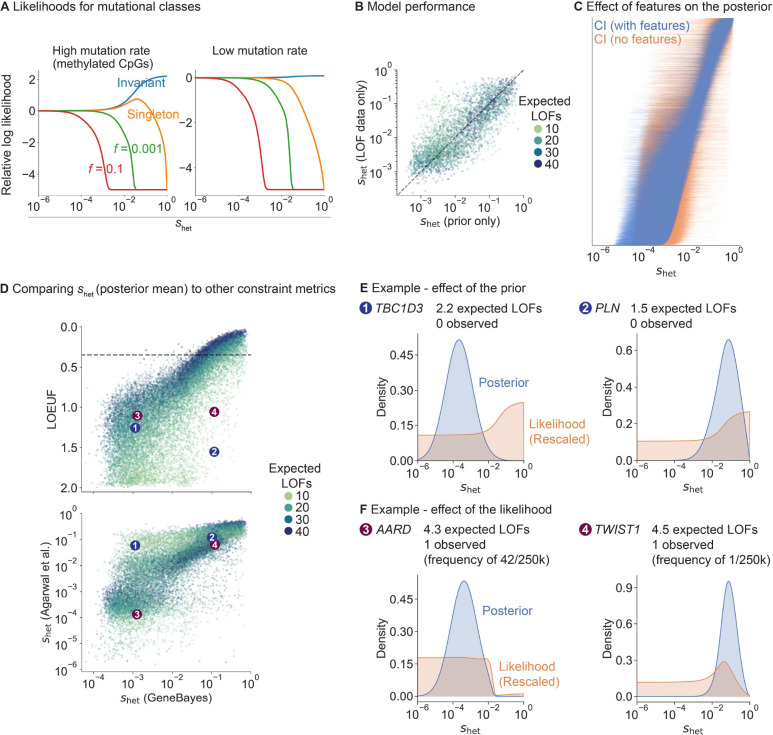
Figure 2: Factors that contribute to our estimates of .
A) Likelihood curves for different allele frequencies (f) and mutation rates. B) Scatterplot of estimated from LOF data (y-axis; posterior mean from a model without features) against the prior’s predictions of (x-axis; mean of learned prior). Dotted line denotes . Each point is a gene, colored by the expected number of LOFs. C) Comparison of posterior distributions of (95% Credible Intervals) from a model with (blue lines) and without (orange lines) gene features. Genes are ordered by their posterior mean in the model with gene features. D) Top: scatterplot of LOEUF (y-axis) and our estimates (x-axis; posterior mean). Each point is a gene, colored by the expected number of LOFs. Bottom: scatterplot of estimates from [4] (y-axis; posterior mode) and our estimates (x-axis; posterior mean). Numbered points refer to genes in panels E and F. E) TBC1D3 and PLN are two example genes where the gene features substantially affect the posterior. We plot their posterior distributions (blue) and likelihoods (orange; rescaled so that the area under the curve = 1). F) AARD and TWIST1 are two example genes with the same LOEUF but different . Posteriors and likelihoods are plotted as in panel E.

