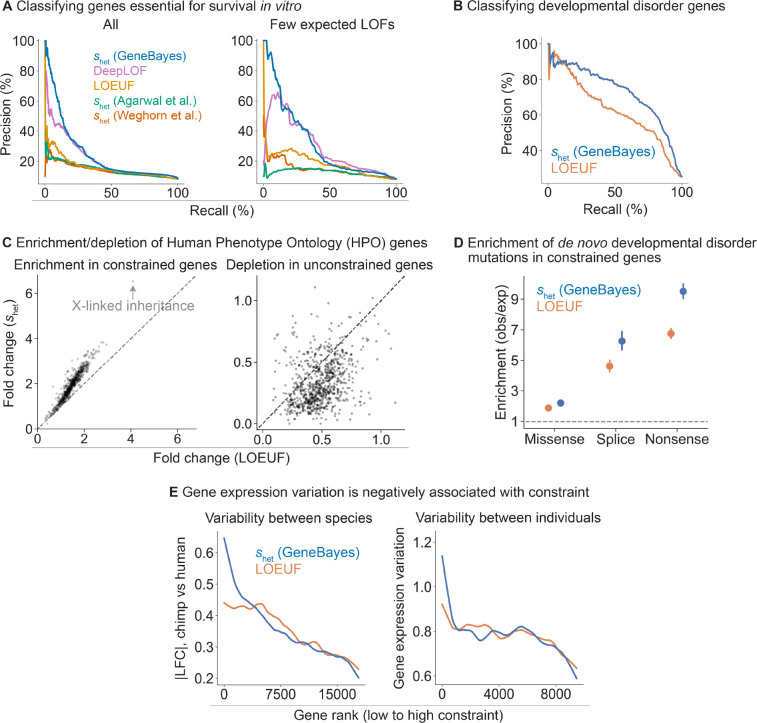
Figure 3: GeneBayes estimates of perform well at identifying constrained and unconstrained genes.
A) Precision-recall curves comparing the performance of against other methods in classifying essential genes (left: all genes, right: quartile of genes with the fewest expected unique LOFs). B) Precision-recall curves comparing the performance of against LOEUF in classifying developmental disorder genes. C) Scatterplots showing the enrichment (respectively depletion) of the top 10% most (respectively least) constrained genes in HPO terms, with genes ranked by (y-axis) or LOEUF (x-axis). D) Enrichment of de novo mutations in patients with developmental disorders, calculated as the observed number of mutations over the expected number under a null mutational model. We plot the enrichment of missense, splice, and nonsense variants in the 10% most constrained genes, ranked by (blue) or LOEUF (orange). Bars represent 95% confidence intervals. E) Left: LOESS curve showing the relationship between constraint (gene rank, x-axis) and absolute log fold change in expression between chimp and human cortical cells (y-axis). Genes are ranked by (blue) or LOEUF (orange) Right: LOESS curve showing the relationship between constraint (gene rank, x-axis) and gene expression variation (normalized standard deviation) in GTEx samples.

