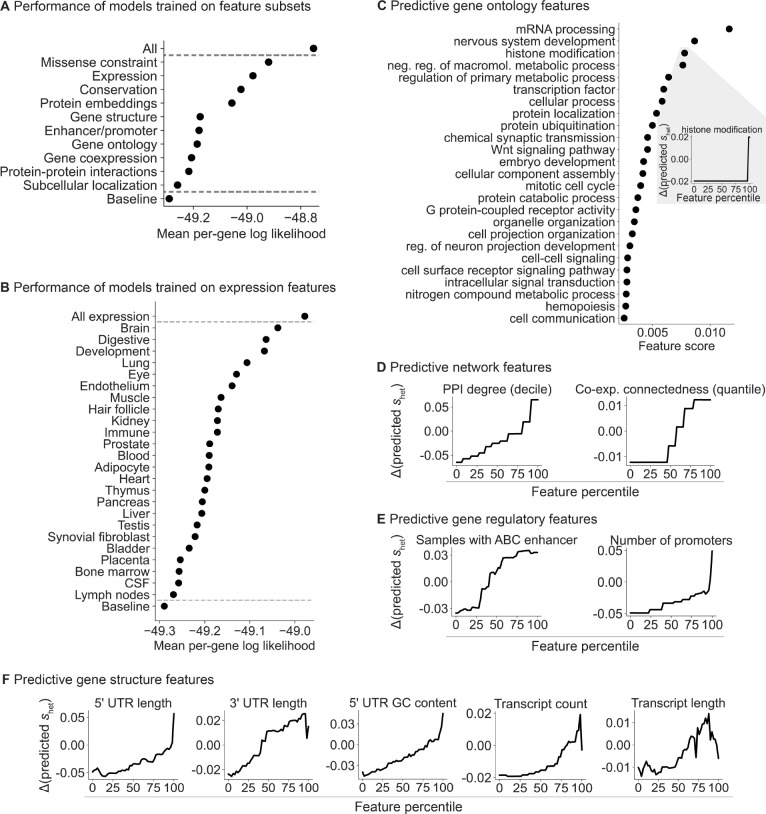
Figure 4: Breakdown of the gene features important for prediction.
A) Ordered from highest to lowest, plot of the mean per-gene log likelihood over the test genes for models separately trained on categories of features. “All” and “Baseline” include all and no features respectively. B) Plot of the mean per-gene log likelihood, as in panel A, for models separately trained on expression features grouped by tissue, cell type, or developmental stage. C) Ordered from highest to lowest, feature scores for individual gene ontology (GO) terms. Inset: lineplot showing the change in predicted for a feature as the feature value is varied. D) Lineplot as in panel C (inset) for protein-protein interaction (PPI) and co-expression features, E) enhancer and promoter features, and F) gene structure features.

