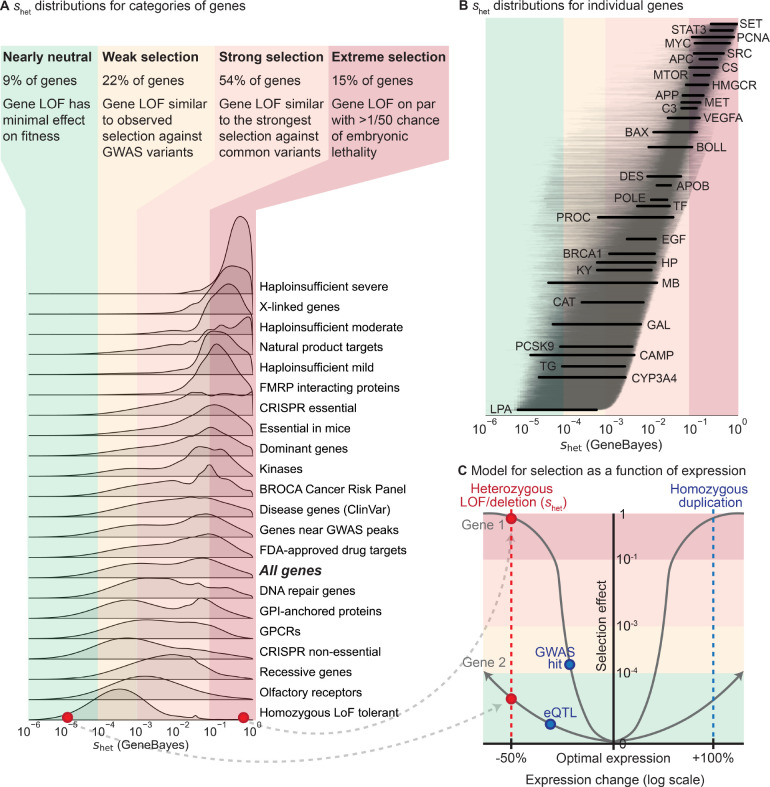
Figure 5: Comparing selection on LOFs () between genes and to selection on other variant types.
A) Distributions of for gene sets, calculated by averaging the posterior distributions for the genes in each gene set. Gene sets are sorted by the mean of their distributions. Colors represent four general selection regimes. B) Posterior distributions of for individual genes, ordered by mean. Lines represent 95% credible intervals, with labeled genes represented by thick black lines. Colors represent the selection regimes in panel A. C) Schematic demonstrating the hypothesized relationship between changes in expression (x-axis, scale) and selection (y-axis) against these changes for two hypothetical genes, assuming stabilizing selection. The shapes of the curves are not estimated from real data. Background colors represent the selection regimes in panel A. The red points and line represent the effects of heterozygous LOFs and deletions on expression and selection, while the blue points and line represent the potential effects of other types of variants.

