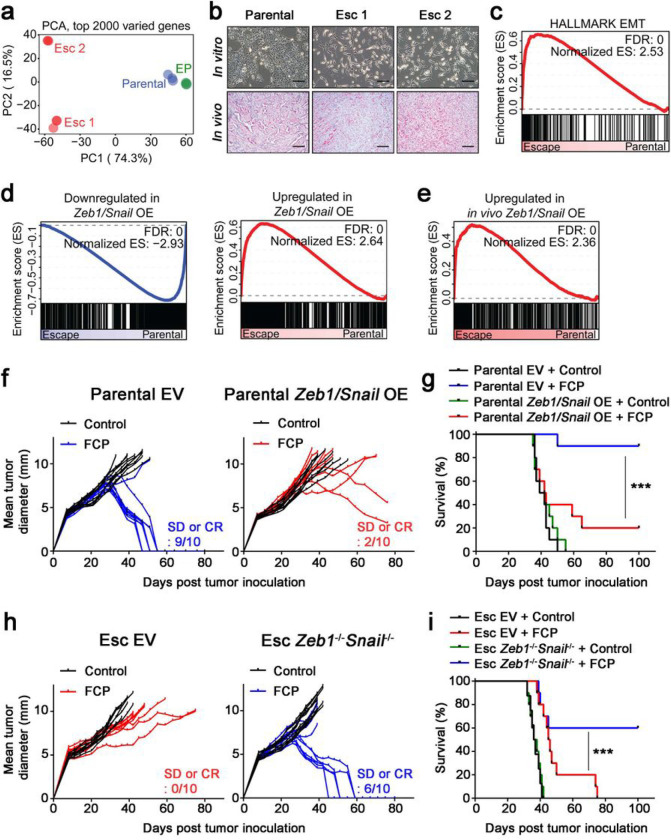
Figure 2. EMT induces immunotherapy resistance in PDAC.
a, Principal component analysis (PCA) plot of RNA-seq data from parental, EP and Esc cell lines (triplicates) is depicted. b, Representative bright field (top) and H&E (bottom) images of cell lines and s.c. implanted tumors on day 18, respectively. Scale bars, 250 μm. c, GSEA of the EMT Hallmark (Molecular Signature Database) in 4662 parental vs. Esc cell lines. Normalized enrichment score (NES) and false discovery rate (FDR) are shown. d, GSEA plots of gene signatures derived from 4662 parental cells overexpressing Zeb1 and Snail (Zeb1/Snail OE) in 4662 parental vs. Esc lines. Gene signatures downregulated (left) and upregulated (right) with Zeb1/Snail OE are shown. e, GSEA plot of a gene signature derived from s.c. implanted Zeb1/Snail OE tumors in s.c. implanted parental vs. Esc tumors. f,g, Individual tumor growth (f) and survival (g) of mice bearing s.c. implanted 4662 parental empty vector (EV, left) and Zeb1/Snail OE (right) tumors treated with either control IgG or FCP (n = 10). h,i, Individual tumor growth (h) and survival (i) of mice bearing s.c. implanted 4662 Esc EV (left) and Zeb1−/−Snail−/− (right) tumors treated with either control IgG or FCP (n = 10). SD, stable disease. Clonal 4662 (C7 and C10) and derived Esc (C7.e1 and C10.e1) lines were used for genetic modification, and both lines showed a similar phenotype. Data represent two independent experiments.

