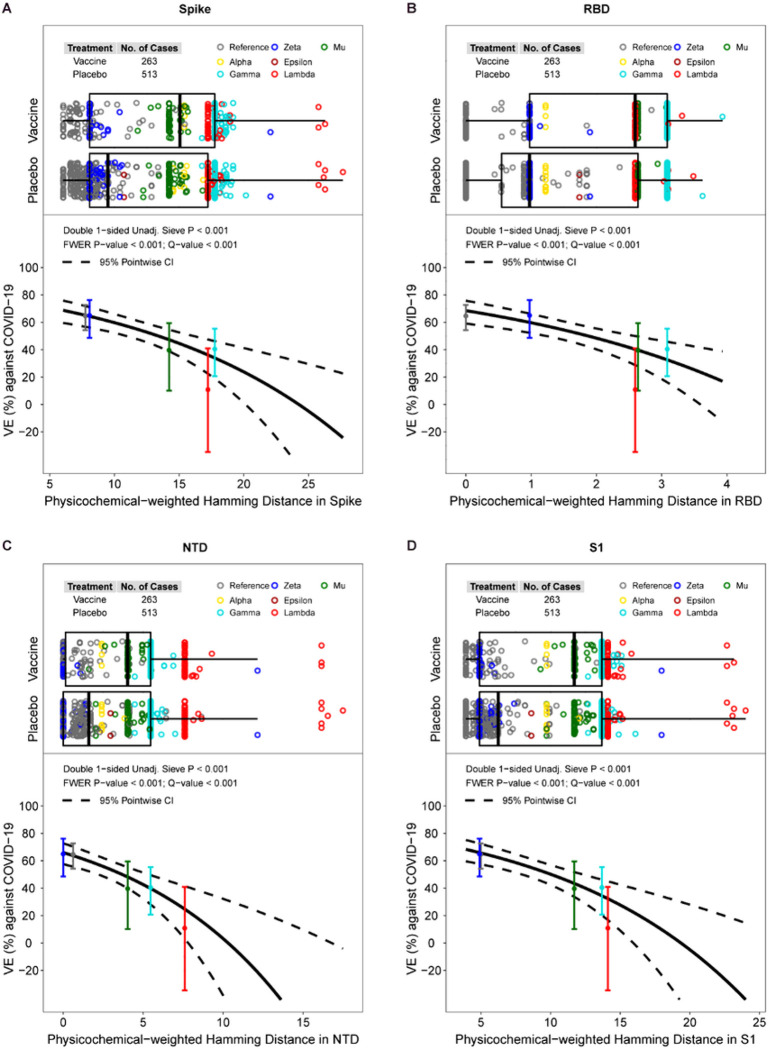
Figure 3. For the Latin America cohort, vaccine efficacy (VE) against the primary COVID-19 endpoint by physicochemical-weighted Hamming distances in (A) Spike, (B) the RBD domain, (3) the NTD domain, or (4) the S1 region of the disease-causing SARS-CoV-2 isolate to that of the vaccine-insert sequence.
The top plot in each panel shows the distributions of distances by treatment arm, color-coded by lineage. The bottom plot in each panel shows the estimated VE by SARS-CoV-2 sequence distance. The dotted lines are pointwise 95% confidence intervals. The dots are overall VE estimates for the given lineage placed at the lineage-specific median distance of placebo arm endpoints, with vertical bars indicating their pointwise 95% confidence intervals. Two Zeta sequences are visible outliers from other Zeta sequences; both sequences have two large deletions (9AA and 7AA in length) in the NTD. The plots reveal that Lambda has two sub-lineages, one (n = 79) with range of distances 17.2–18.9 and a second (n = 9) with range of distances 25.8–27.7, due to a 13-AA deletion between sites 64 and 76.

