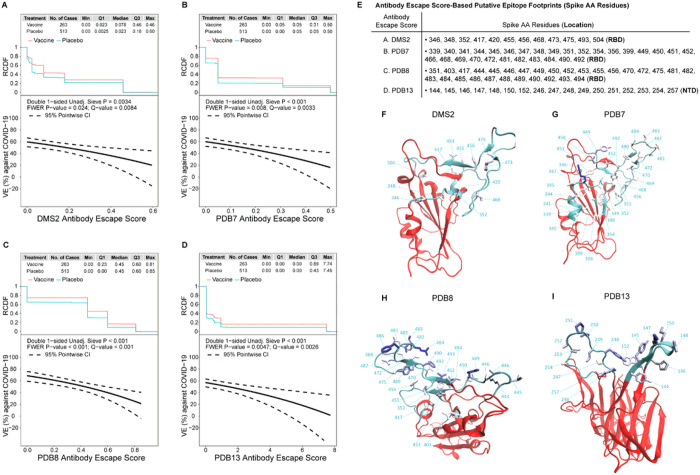
Figure 4. In the Latin America cohort, vaccine efficacy (VE) against the primary COVID-19 endpoint by the SARS-CoV-2 antibody escape score.
VE (point estimates as solid line, 95% confidence intervals as dashed lines) is shown by the antibody escape scores for: (A) DMS2, (B) PDB7, (C) PDB8, (D) PDB13. The plot at the top of each panel shows the reverse cumulative distribution function (RCDF) of the relevant antibody-binding escape score across SARS-CoV-2 viruses by treatment arm. (E) Spike amino acid (AA) residues constituting each antibody escape score-based putative epitope footprint. (F-I) For each set of residues constituting an antibody epitope footprint for DMS2, PDB7, PDB8, and PDB13, the image shows the set of AA positions comprising the footprint on a Spike monomer NTD or RBD structure. Cyan ribbons highlight epitope footprint residues while red ribbons make up the rest of RBD [(F) DMS2, (G) PDB7, and (H) PDB8)] or NTD (I) (PDB13). Residue numbers and cyan dashed lines are used to label footprint residues. Each structure’s orientation was chosen to best visualize all residues of a footprint. Residues are colored based on their cluster weights going from white to blue with increasing weight.

