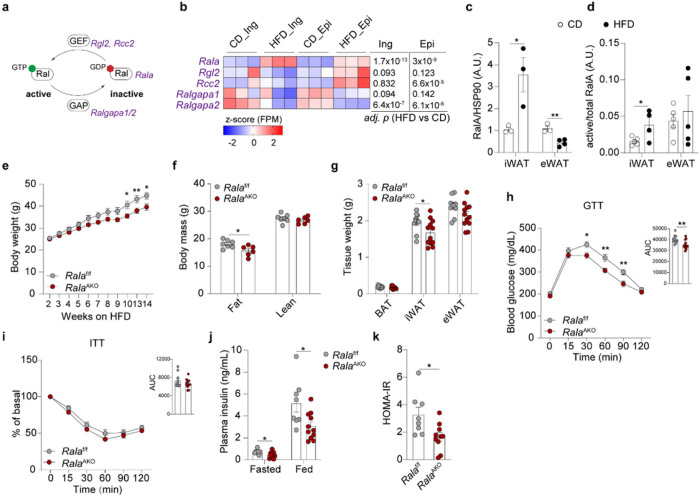
Figure 1. White adipocyte-specific Rala deletion protects mice from high fat diet-induced obesity.
a, Scheme illustrating RalA activation network involving genes encoding RalA, GEF and GAP b, RNA-seq analysis of primary inguinal and epididymal mature adipocytes isolated from mice (n = 3) under 16-weeks HFD feeding. Heatmap displays transcriptional expression as z-scored FPM values. Adjusted p-values are indicated and considered significant with value < 0.05. c, Quantification of RalA protein content in mature adipocytes from iWAT and eWAT of mice fed with CD or HFD for 16 weeks (n = 3–4). d, Quantification of RalA GTPase activity in iWAT and eWAT of mice fed with CD or HFD for 4 weeks (n = 4). e, Body weight of Ralaf/f and RalaAKO mice (n = 8–10) fed with 60% HFD. f, Body mass of Ralaf/f and RalaAKO mice (n = 6–7) fed with HFD for 12 weeks, g, Fat depot weights of Ralaf/f and RalaAKO mice (n = 10–12) fed with HFD for 12 weeks, h, GTT on 11-weeks HFD-fed Ralaf/f and RalaAKO mice (n = 10–13); AUC was calculated from longitudinal chart, i, ITT on 12-week HFD-fed Ralaf/f and RalaAKO mice (n = 11–12); AUC was calculated from longitudinal chart, j, Plasma insulin levels in 8-week HFD-fed Ralaf/f and RalaAKO mice (n = 11). k, HOMA-IR was calculated using fasting glucose and insulin levels from 8-weeks HFD-fed Ralaf/f and RalaAKO mice (n =8–10). The data (c-k) are shown as the mean ± SEM, *p < 0.05, **p < 0.01, ***p < 0.001 by unpaired t-test (c, d, f, g, j, k) or two-way ANOVA with Bonferroni’s multiple comparison as post-test (e, h, i).

