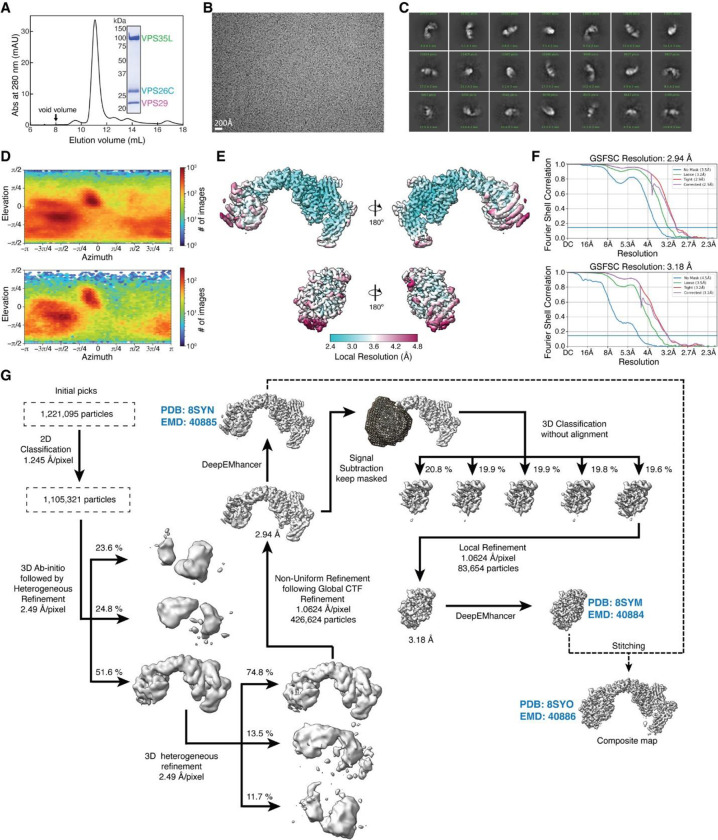
Extended Data Fig. 1. Purification and cryo-EM structural determination of Retriever.
(A) Gel filtration chromatography of the purified Retriever complex. (B) Representative cryo-EM micrograph. (C) Representative 2D class averages. (D) Euler angle distribution plots for Retriever (upper) and the locally refined VPS29 with the NT “belt” peptide and the CT region of VPS35L (lower). (E) Local resolution map of Retriever (upper) and the locally refined VPS29 with the NT “belt” peptide and the CT region of VPS35L (lower). (F) Fourier Shell Correlation (FSC) plot for Retriever (upper) and the locally refined VPS29 with the NT “belt” peptide and the CT region of VPS35L (lower). (G) Schematic showing cryo-EM data processing steps for obtaining 3D reconstruction of Retriever. The three maps deposited to PDB/EMDB are labeled.

