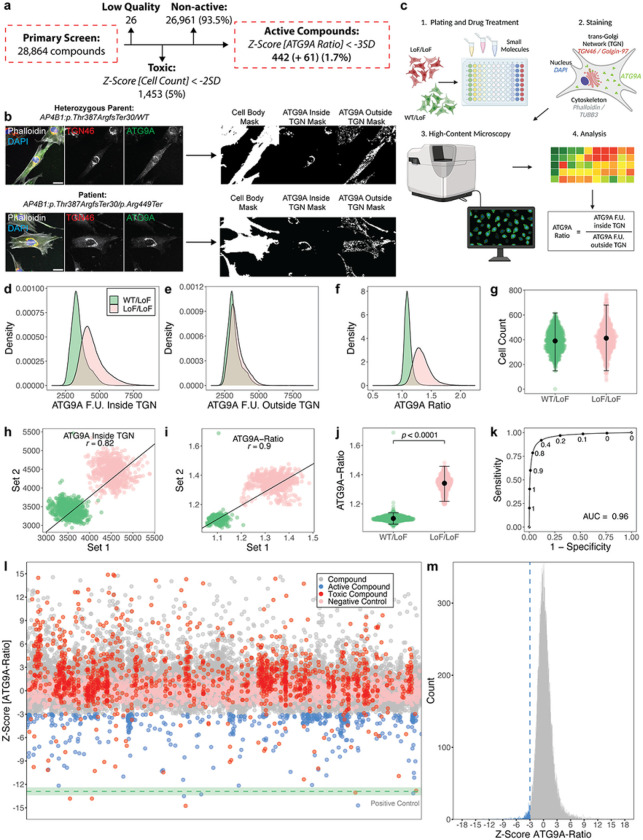
Figure 1. Establishment of a cell-based phenotypic small molecule screening platform using ATG9A translocation as a surrogate for AP-4 function and primary screening of 28,864 novel small molecule compounds.
(a) Overview of the primary screening of 28,864 novel small molecule compounds in fibroblasts from a patient with AP-4-HSP due to biallelic loss-of-function variants in AP4B1. (b) Illustration of the automated image analysis pipeline. Representative images of fibroblasts from a patient with HSP-SPG47 (negative control, LoF/LoF) and their sex-matched heterozygous parent (positive control, WT/LoF) are shown. Four markers are captured including Phalloidin (grey), DAPI (blue), TGN (red) and ATG9A (green). The TGN and ATG9A channels are additionally depicted in greyscale. Through a series of masks, the intracellular distribution of ATG9A is calculated at the level of individuals cells, with hundreds of thousands to millions of cells per experiment. Scale bar: 20μm. (c) Overview of the high-throughput platform and workflow. The assay is miniaturized to 96- or 384-well microplates. Cells are stained using automated liquid handlers and imaged using an automated high-content confocal microscope, followed by automated image analysis. Primary metric is the ‘ATG9A ratio’, which is calculated by dividing the ATG9A fluorescence intensity (F.U.) inside the TGN by the ATG9A fluorescence intensity in the cytoplasm. (d-f) The distribution of ATG9A fluorescence intensities inside (d) and outside (e) the TGN, as well as the ATG9A ratio (f) are shown on a per cell basis. 99,927 WT/LoF and 119,522 LoF/LoF cells were quantified. (g) Cell counts are measured for each experimental well. 1312 wells were analyzed per condition. (h&i) Replicate plots were generated by random sampling of the 82 plates from the primary screen in two groups. Similar positions on the assay plates were plotted against each other with respect to the ATG9A fluorescence intensity inside the TGN (h) and the ATG9A ratio (i). Replicate correlations for both analysis strategies were assessed by averaging the Pearson correlation coefficients of 100 random sampling tests. The ATG9A ratio shows a mean Pearson correlation coefficient (r) of 0.9, while the ATG9A fluorescence inside the TGN shows an average r of 0.82. (j) To demonstrate the discriminative power of the ATG9A ratio in separating positive and negative controls, statistical testing was done using the Mann-Whitney U test. Quantification was done using per well means. 1312 wells per condition were included. Positive and negative controls showed a robust separation (p < 0.0001). (k) To test the robustness of separation of the ATG9A ratio between positive (WT/LoF) and negative controls (LoF/LoF), a dataset containing measurement for 99,927 WT/LoF and 119,522 LoF/LoF cells was partitioned into a training set (70% of data) and a test set (30%). A generalized linear model was trained using the training set. The performance of the prediction model using the test set is shown in (k). The AUC is 0.96. (l) Impact of 28,864 compounds applied for 24h at a concentration 10μM. Z-scores for the primary metric, the ATG9A ratio, are shown. All data points represent per well means. The mean of the positive control (WT/LoF) is shown as a green dotted line. The green shaded areas represent ± 1 SD. Active compounds were a priori defined as those reducing the ATG9A ratio by at least 3 SD compared to negative controls. Toxicity was defined as a reduction of cell count of at least 2SD compared to the negative control. 501 compounds show activity by reducing the ATG9A ratio by more than 3 SD. (m) Distribution of Z-scores of all non-toxic 27,412 compounds. Active compounds are highlighted in blue.

