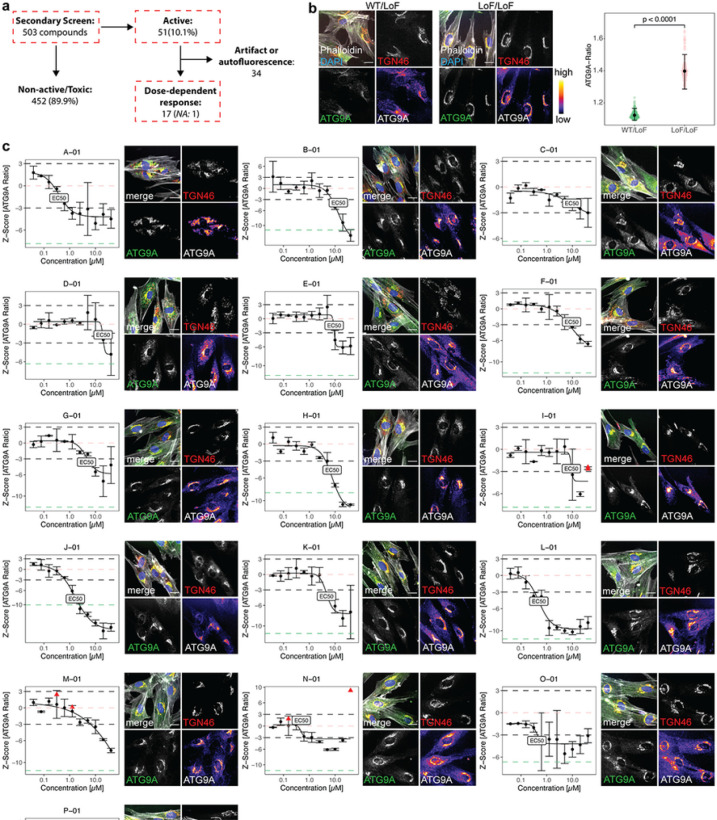
Figure 2. Counter-screen in fibroblasts from AP-4-HSP patients confirms 16 compounds that lead to dose-dependent redistribution of ATG9A.
(a) Overview of the counter-screen of the 503 active compounds identified in the primary screen. To assess for dose-dependent effects, compounds were screened in AP-4-HSP patient-derived fibroblasts in 384-well microplates using 11-point titrations ranging from 40nM to 40μM. All concentrations were screened in duplicates. Active compounds were a priori defined as those reducing the ATG9A ratio by at least 3SD compared to negative controls, in more than one concentration. Toxicity was defined as a reduction of the cell count of at least 2 SD compared to negative controls. 51 compounds demonstrated a clear and reproducible dose-response relationship and raised no suspicion for autofluorescence on automated and manual review. 34 compounds showed autofluorescence or resulted in imaging artifacts. One active compound was unavailable from the manufacturer and was therefore excluded from subsequent testing. (b) Baseline differences in the ATG9A distribution in WT/LoF (n=269) vs. LoF/LoF (n=269) fibroblasts. Statistical testing was done using the Mann-Whitney U test. Positive and negative controls showed a robust separation (p < 0.0001). (c) Dose-response curves were fitted using a four-parameter logistic regression model, and EC50 concentrations were calculated. All concentrations were tested in biologic duplicates. Most EC50 were in the low micromolar range (median: 4.66mM, IQR: 8.63). Black dashed lines represent the a priori defined thresholds of +/− 3SD compared to the negative control (LoF/LoF). Red triangles represent toxic concentrations based on the a priori defined threshold of a reduction of cell counts of at least 2 SD compared to the negative control. The salmon-colored dashed line represents the mean of negative controls, while the green-colored dashed line depicts the mean of the positive controls (WT/LoF). Representative images of the EC50 are shown for each active compound. Representative images show a merge of the 4 channels: Phalloidin (grey), DAPI (blue), TGN (red) and ATG9A (green), as well as the TGN and ATG9A channels in greyscale. For better illustration of differences in ATG9A signals, the fluorescence intensities of the ATG9A channel are additionally shown using a color lookup table. Scale bar: 20μm. NA: not available

