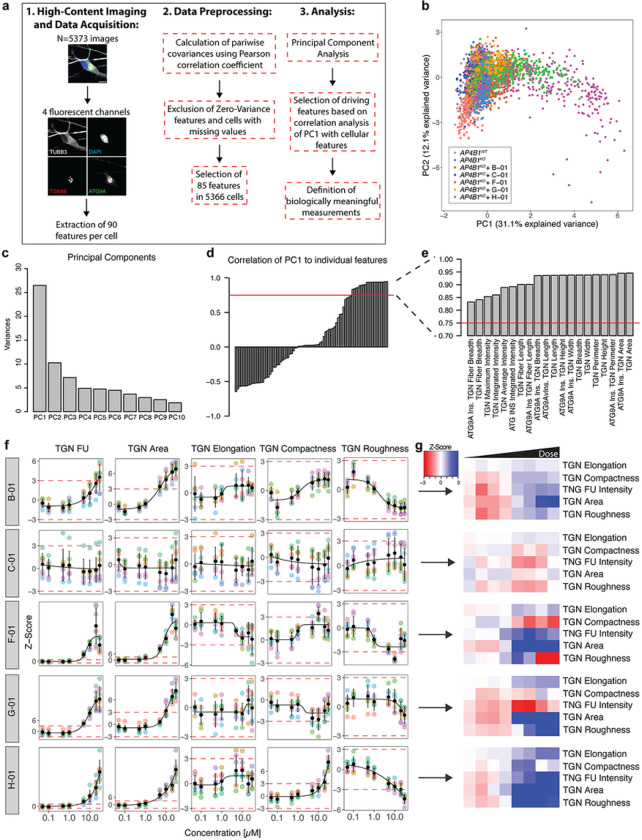
Figure 4. Multiparametric profiling of 5 active compounds in AP4B1KO SH-SY5Y cells.
(a) Multiparametric profiling of images of 5373 cells were acquired using 4 fluorescent channels. Scale: 10μm. A total of 90 measurements per cell were generated for the cytoskeleton (beta-3 tubulin), the nucleus (DAPI), the TGN (TNG46) and ATG9A vesicles (ATG9A). The different steps of data preprocessing and phenotypic clustering using principal component analysis (PCA) are shown. (b) PCA shows different clusters of cells based on 85 phenotypic features. Experimental conditions are color-coded. The first two principal components (PC1 and PC2) explain 43.2% of the observed variance. (c) Bar plot summarizing the variance explained by the first 10 principal components (PCs). Most of the variance is explained by PC1 and to a lesser degree PC2. (d) Correlation analysis of PC1 with all 85 features using the Pearson correlation coefficient. Red dashed lines represent cut-offs for correlations >0.75. (e) Zoom-in on selected features of interest showing a correlation with PC1 >0.75. (f) Measurements of TGN intensity and descriptors of TGN shape and network complexity for the individual hit compounds as line graphs and (g) summarized using heatmap visualization.

