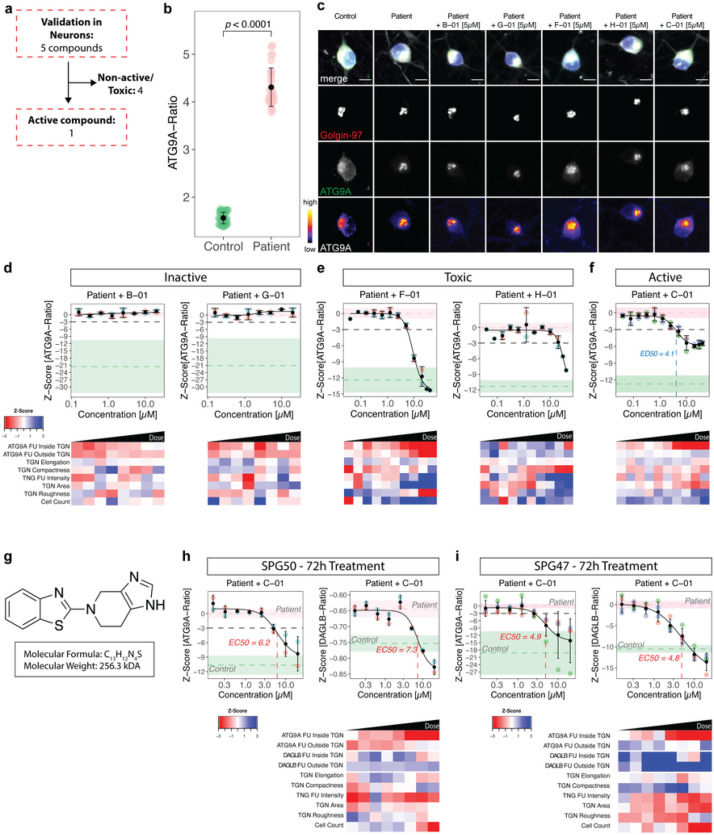
Figure 5. Compound C-01 restores ATG9A and DAGLB trafficking in iPSC-derived neurons from AP-4-HSP patients.
(a) Overview of the testing of 5 active compounds in iPSC-derived cortical neurons from a patient with AP4M1-associated SPG50 compared to heterozygous controls (same-sex parent). Active compounds were defined as those reducing the ATG9A ratio by at least 3 SD compared to negative controls (patient-derived iPSC-neurons treated with vehicle). Toxicity was defined as a reduction of cell count of at least 2 SD compared to the negative control. (b) Baseline differences of ATG9A ratios in controls vs. patient-derived iPSC-neurons were quantified using per well means of 60 wells per condition from 5 plates. Statistical testing was done using the Mann-Whitney U test. Positive and negative controls showed a robust separation (p < 0.0001). (c) Representative images of iPSC-neurons from a patient with SPG50 treated with individual compounds at 5μM for 24h (~EC50 in prior experiments). The merge shows beta-3 tubulin (grey), DAPI (blue), the Golgi (red) and ATG9A (green). The Golgi and ATG9A channels are further separately depicted in greyscale. For better illustration of differences in ATG9A signals, the fluorescence intensities of the ATG9A channel are additionally shown using a color lookup table. Scale: 10μm. (d-f) Dose-response curves for ATG9A ratios in iPSC-neurons from a patient with SPG50 treated with individual compounds for 24h, along with their morphological profiles depicted as heatmaps. All data points represent per-well means of 3–4 independent differentiations. Dashed lines show mean Z-scores for positive (green) and negative (salmon) controls. Shaded areas represent ± 1SD. (g) Chemical synthesis and structure of lead compound C-01. (h&i) Dose-response curves for ATG9A and DAGLB ratios in iPSC-neurons from a patient with SPG50 (h) and an additional patient with SPG47 (i) after prolonged treatment with C-01for 72h, along with the morphologic profile depicting changes in cellular ATG9A and DAGLB distribution, TGN intensity and morphology and cell count. All data points represent per-well means of 2 independent differentiations. Dashed lines show mean Z-scores for positive (green) and negative (salmon) controls. Shaded areas represent ± 1 SD.

