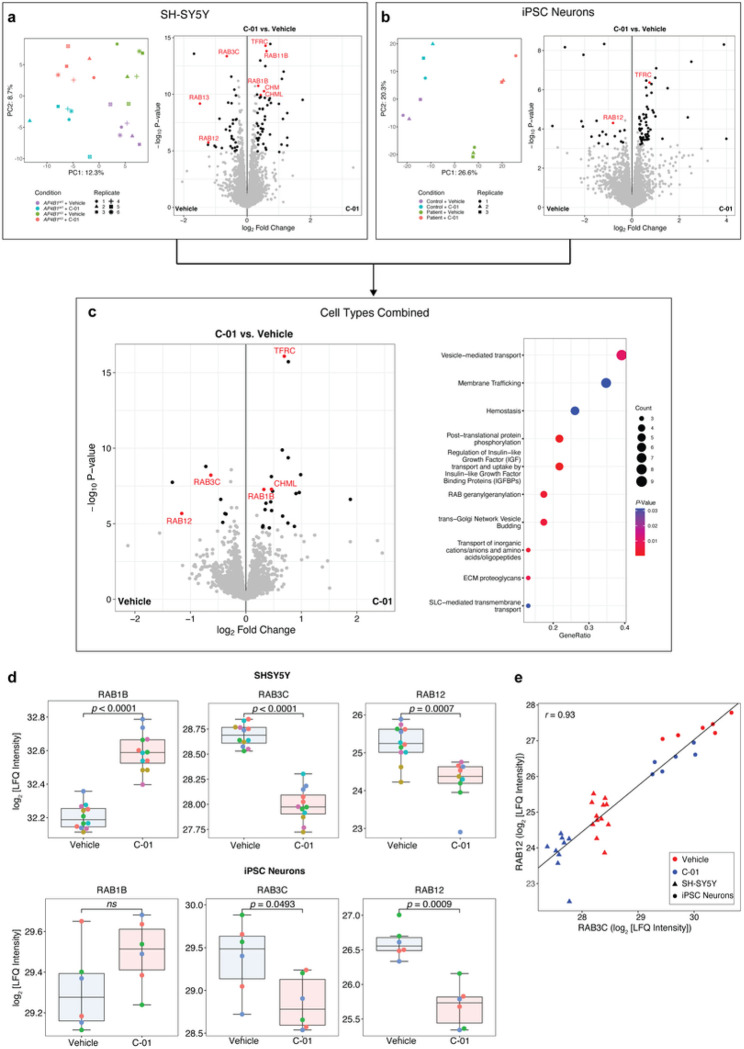
Figure 7. Target deconvolution using unbiased quantitative proteomics in AP4B1KO SH-SY5Y cells and AP-4-HSP patient-derived iPSC-neurons treated with C-01.
(a – c) Differential protein enrichment analysis. Statistical testing was done using protein-wise linear models and empirical Bayes statistics. Proteins were considered as differentially enriched with a false discovery rate of < 0.05 and a log2 fold change > 0.3. (a) SH-SY5Y cells: 8141 unique proteins were analyzed. PCA of the top 500 variable proteins shows robust separation between experimental conditions. The volcano plot summarizes differential protein enrichment for AP4B1WT and AP4B1KO cells pooled into two groups, vehicle vs. C-01 treated. Differentially enriched proteins are depicted in black. Proteins with the most consistent enrichment profiles across all experimental conditions (see Supplementary Fig. 6a-d) are colored and labeled in red. (b) iPSC-derived neurons: 7386 unique proteins were analyzed. PCA of the top 500 variable proteins shows robust separation between experimental conditions. The volcano plot summarizes differential protein enrichment for control and patient-derived neurons pooled into two groups, vehicle vs. C-01 treated. Differentially enriched proteins are depicted in black. Proteins with the most consistent enrichment profiles across all experimental conditions (see Supplementary Fig. 6e-h) are colored and labeled in red. (c) Integrated analysis of SH-SY5Y cells and iPSC-derived neurons: 5357 unique proteins were analyzed. The volcano plot summarizes differential protein enrichment for control and AP-4-deficient cells pooled into two groups, vehicle vs. C-01. Proteins with the most consistent enrichment profiles across all experimental conditions (see Supplementary Figure 6i-l) are colored and labeled in red. The dot plot summarizes dysregulated Reactome pathways of the pooled analysis. Pathways were considered differentially expressed with an FDR < 0.05. (d) The RAB protein family members RAB1B, RAB3C and RAB12 showed the most consistent profiles in response to C-01 treatment and were selected for further analysis. LFQ intensities in SH-SY5Y cells (AP4B1WT and AP4B1KO pooled) and neurons (control and patient pooled) are shown. Statistical testing was done using pairwise T-tests. P-values were adjusted for multiple testing using the Benjamini-Hochberg procedure. (e) LFQ intensities of RAB3C and RAB12 in AP4B1WT (n = 11 samples) and AP4B1KO (n = 10 samples) SH-SY5Y cells, as well as control (n = 6 samples) and patient-derived (n = 6 samples) iPSC-derived neurons show a high degree of correlation measured by the Pearson correlation coefficient (r). While there was no difference between genotypes (not shown), C-01 treated cells showed reduced protein levels of both RAB3C and RAB12.

