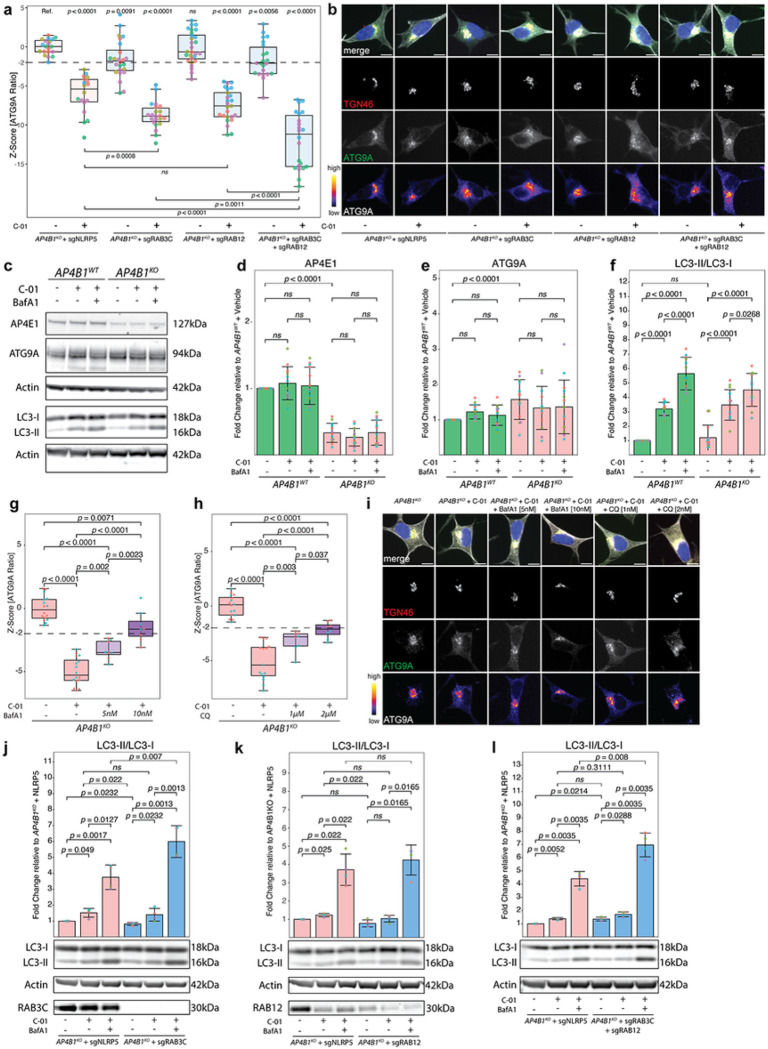
Figure 8. RAB3C and RAB12 are involved in C-01-mediated vesicle trafficking and enhancement of autophagic flux.
(a) AP4B1KO SH-SY5Y cells were transfected for 72h with RNPs targeting RAB3C, RAB12 or both compared to NLRP5 as a non-essential control. Vehicle vs. C-01 treatment at a concentration of 5μM was administered for 24h. Each experimental condition was tested in 18–28 wells from 3–5 independent plates. The dashed line represents a reduction of the ATG9A ratio of −2 SD compared to the negative control (AP4B1KO + sgNLRP5). Knockout of RAB12 did not significantly alter the ATG9A ratio, while RAB3C knockout led to a reduction of −2 SD. Combining the knockout of RAB3C and RAB12 did not result in an additive effect. However, both RAB3C and RAB12 knockout potentiated the effect of C-01 treatment on ATG9A translocation, which was further enhanced by combined knockout. (b) Representative images of the intracellular ATG9A distribution for different conditions. The merged image shows beta-3 tubulin (grey), DAPI (blue), the TGN (red) and ATG9A (green). The TGN and ATG9A channels are further separately depicted in greyscale. Scale bar: 10μm. (c-f) Representative western blot of whole cell lysates. Cells were treated with vehicle vs. C-01 at a concentration of 5μM for 72h. All experiments were performed in four biological replicates. As expected, AP4E1 levels were reduced in AP4B1KO cells, indicating reduced AP-4 complex formation. ATG9A ratios were significantly increased in AP4B1KO cells and were not altered by C-01 treatment. By contrast, the conversion of LC3-I to LC3-II was significantly elevated in response to C-01 in both AP4B1WT and AP4B1KO cells. To confirm that this increase was due to an increase in autophagic flux, autophagosome-lysosome fusion was blocked by adding bafilomycin A1 at a concentration of 100nM for 4 h prior to cell harvest. (g-h) AP4B1KO SH-SY5Y cells were treated for 72h with vehicle, C-01 (5μM) alone, or C-01 in combination with ascending non-toxic doses of either bafilomycin A1 (5nM or 10nM) or chloroquine (1μM or 2μM). Each experimental condition was tested in 16 wells from 2 independent plates. The dashed line represents a reduction of the ATG9A ratio of −2 SD compared to the negative control (AP4B1KO). As expected, C-01 treatment alone led to a considerable reduction of the ATG9A ratio. Block of late stages of autophagy using either bafilomycin A1 or chloroquine reversed the effect of C-01 in a dose dependent manner. (i) Representative images of the intracellular ATG9A distribution for different conditions. The merged image shows beta-3 tubulin (grey), DAPI (blue), the TGN (red) and ATG9A (green). The TGN and ATG9A channels are further separately depicted in greyscale. Scale bar: 10μm. (j-l) Western blots of whole cell lysates of AP4B1KO SH-SY5Y cells transfected for 72h with RNPs against RAB3C, RAB12 or both, compared to NLRP5. Vehicle vs. C-01 treatment was administered for 48h. While neither RAB3C (g) nor RAB12 (h) knockout alone led to an increase in baseline LC3-II, the combined knockout raised the LC3-II to LC3-I ratio to levels achieved with C-01 treatment alone (i). In response to bafilomycin A1 treatment (100nM for 4 h) both RAB3C knockout alone and the combined knockout of RAB3C and RAB12 led to a significant increase in LC3-II to LC3-I ratios. Statistical testing in all experiments was done using pairwise T-tests. P-values were adjusted for multiple testing using the Benjamini-Hochberg procedure.

