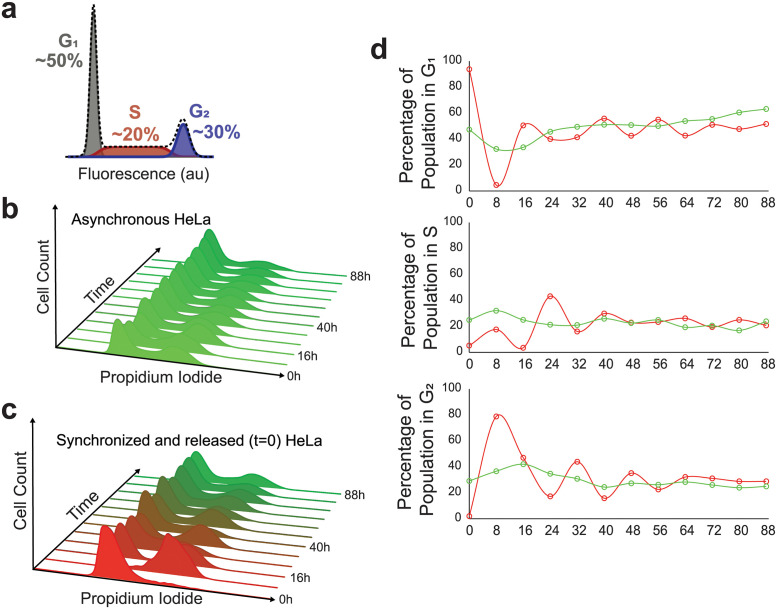
Fig 1. Cell desynchronization via double thymidine block and release.
a) Cell cycle phases as indicated by cell DNA content and approximate phase distribution in an asynchronous population. b) Fluorescent profile of propidium iodide (PI) stained cells during asynchronous growth from t = 0 to t = 88. c) Fluorescent profile of PI-stained cells following G1/S synchronization by double thymidine block from t = 0 to t = 88. d) Percentages of cells in a given cell cycle phase at a given time point; asynchronous cell growth in green and desynchronous cell growth in red. The cell cycle phase percentages for each time point were determined via the Dean-Jett-Fox model.

