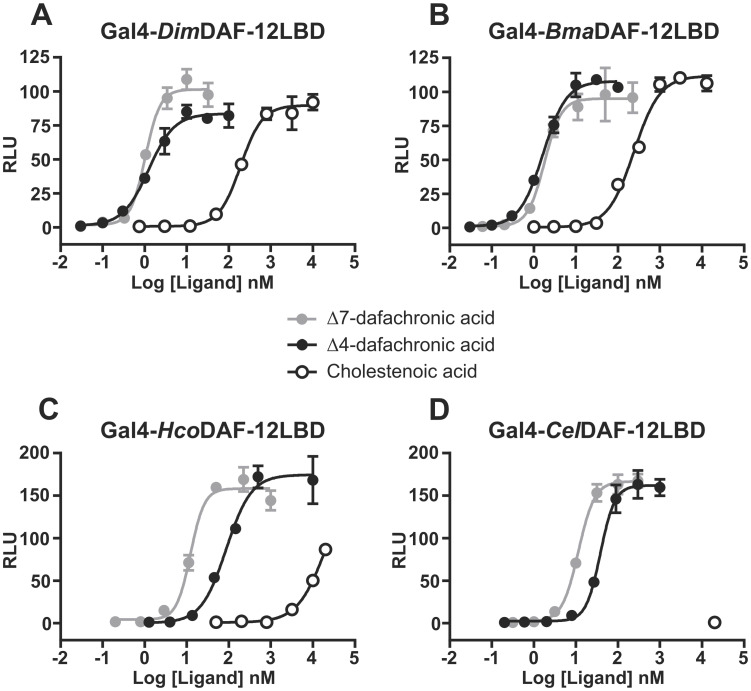
Fig 2. Dose-response curves for Δ7-DA, Δ4-DA and CA on the activation of (A) DimDAF-12, (B) BmaDAF-12, (C) HcoDAF-12 and (D) CelDAF-12. NIH3T3 cells were co-transfected with Gal4-DAF-12_LBD and the luciferase gene reporter construct.
Recombinant cells were incubated with increasing concentrations of Δ4-DA, Δ7-DA or CA. The ligand binding and transactivation activity were assessed by measuring the luciferase activity, which was normalized by Renilla luciferase activity for transfection efficiency and expressed as relative light units (RLU). Data representing normalized luciferase activities are plotted with non linear regression fit using sigmoidal dose-response with variable slope (Prism 6.0, Graph Pad Software, Inc.). The figure shows one representative experiment out of two. Values are means of technical triplicates ± standard deviation.

