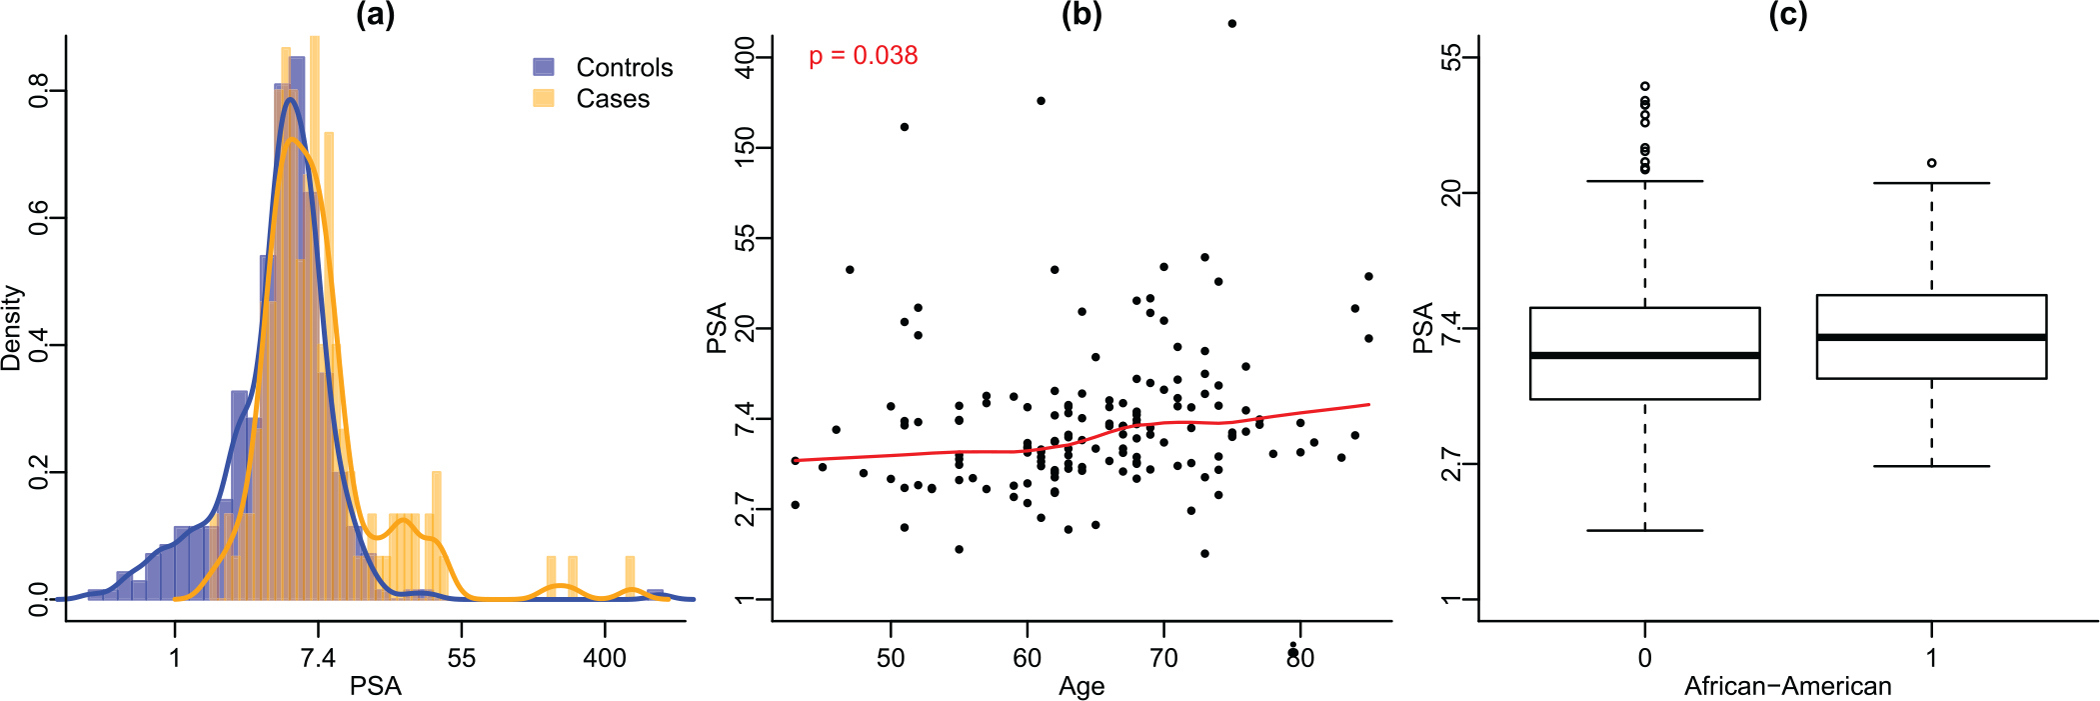
FIGURE 1.

Exploratory plots for the clinical study. Panel (a): Histograms of PSA for cases and controls with density curves overlaid. Panel (b): Scatterplot of PSA versus age, cases only. The red solid line is fitted by loess and the p-value is obtained from testing zero Pearson’s correlation coefficient. Panel (c): Boxplot of PSA of African American population and non-African American group, cases only. This figure appears in color in the electronic version of this article, and any mention of color refers to that version
