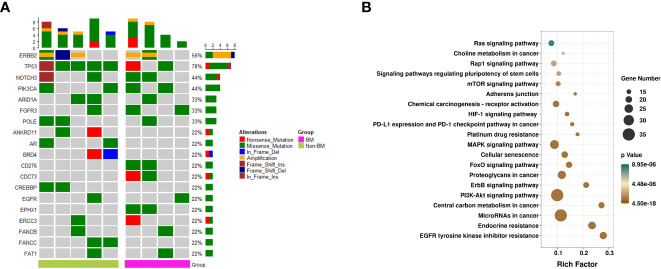
Figure 2.
Mutational landscape and KEGG pathways. (A) Mutational landscape of primary breast tumors from four of seven patients with BM and five of 10 patients without BM. Displayed are mutations, indels, and amplification likely to be pathogenic, summarized by gene for each patient. Bottom bar refers to group (BM and non-BM). Right, variant classification of the alterations within each gene. (B) KEGG pathways of all samples from patients with BM (including 17 plasma samples and four tissue samples of primary breast tumors). The y-axis represents KEGG-enriched terms. The x-axis represents the rich factor. The size of the dot represents the number of genes under a specific term. The color of the dots represents the adjusted p-value. BM, brain metastasis; KEGG, Kyoto Encyclopedia of Genes and Genomes.

