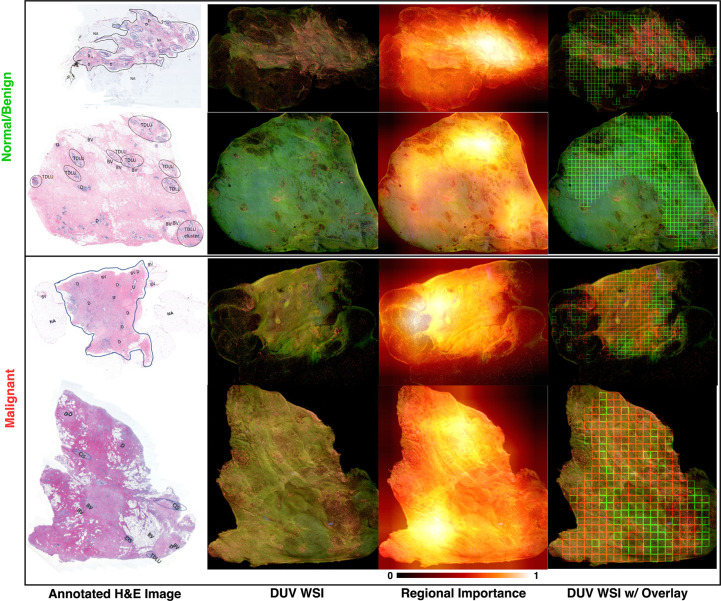
Figure 3.
DUV WSI with corresponding H&E image and regional importance map for malignant and normal/benign samples: Regional importance areas contain high entropy, high content/semantics (3rd column). It focuses on the strong semantic areas to help in the classification. Note that the images are inputs into a pre-trained DenseNet169 with ImageNet weights, and Grad-CAM++ extracted the heatmaps where the relevancy of the tissue areas is determined from 0 to 1. Red and green bounding boxes in DUV WSIs (last column) represent malignant and normal/benign patches thresholded by regional importance, respectively. Large DUV WSIs are scaled down for visualization.

