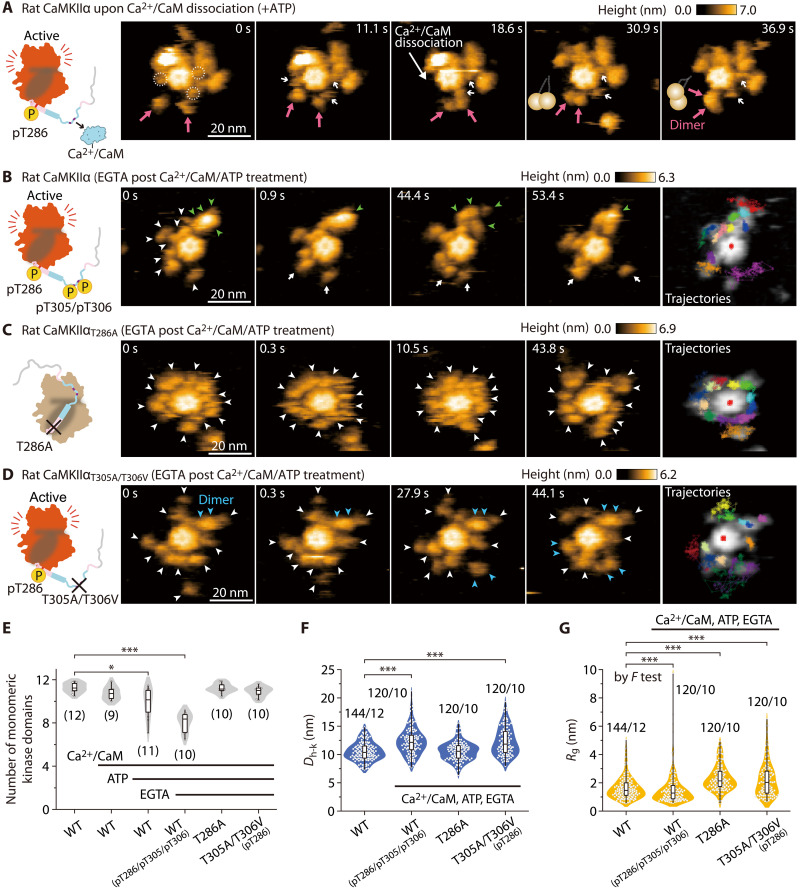
Fig. 3. Fully phosphorylated rat CaMKIIα (pT286/pT305/pT306) exhibits KD-oligomerization.
(A) Sequential HS-AFM images of rat CaMKIIα at the time of stable dimer formation (see also movie S3B). CaMKIIα was activated by Ca2+/CaM and ATP (1 mM Ca2+, 800 nM CaM, and 1 mM ATP). Dotted white circles and white arrows indicate Ca2+/CaM. Magenta arrows indicate the formation of stable dimers. Frame rate, 3.3 frames/s [also in (B) to (D)]. (B) Sequential HS-AFM images of pT286/pT305/pT306 rat CaMKIIα. CaMKIIα was first activated to induce pT286, as described in (A). Subsequently, EGTA (2 mM) was added to induce Ca2+/CaM dissociation and pT305/pT306 (autophosphorylation) [also in (C) and (D)]. Arrowheads indicate kinase domains (green, oligomer; blue, dimer; white, monomer) [also in (C) and (D)]. Criteria of oligomer are described in Materials and Methods. (C) Sequential HS-AFM images of rat CaMKIIαT286A (see also movie S4). This mutant does not autophosphorylate at Thr286/Thr305/Thr306 (fig. S4, lanes #3 to 5). (D) Sequential HS-AFM images of pT286 rat CaMKIIαT305A/T306V (see also movie S5). (E) The number of monomeric kinase domains (i.e., the 4-nm objects surrounding the hub assembly of CaMKIIα). The number of samples (holoenzymes) is indicated in the figure. *P < 0.05 and ***P < 0.001 (Kruskal-Wallis test with Dunnett’s post hoc test) [also in (F) and (G)]. (F and G) Dh-k (F) and Rg (G) for the respective conditions. The number of samples (kinases/holoenzymes) is indicated in the figure. (G) To compare variances, F test was performed between Ctrl and pT286/pT305/pT306 in the wild type. HS-AFM experiments were repeated at least three times independently with similar results.

