
Figure 5. Fibrin gels substantially decreased in volume with deformation.
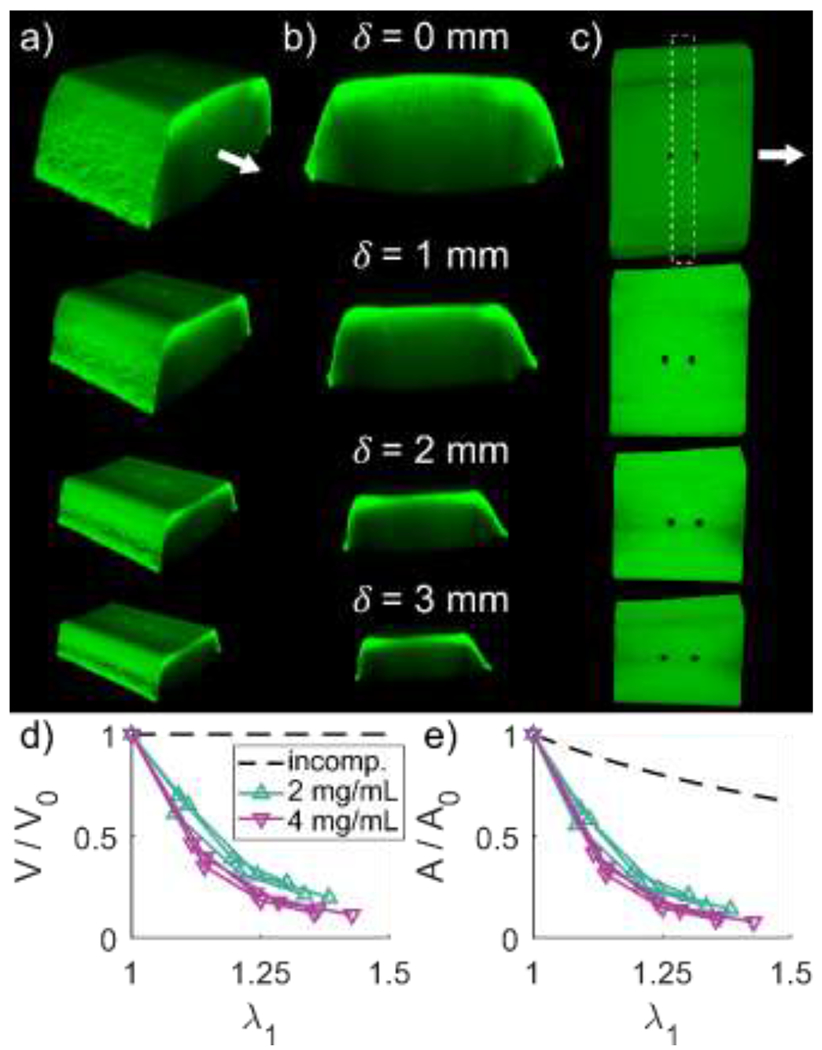
Macroscale image stacks were taken at increasing levels of deformation to quantify changes in gel geometry. Isometric (a), cross-sectional (b) and top-down (c) views of a representative fibrin gel are shown for deformations of 0, 1, 2, and . Stretch was defined by measuring the distance between photobleached markers as shown in (c, top). Volume was defined between the photobleached markers, and cross-sectional area was defined by all image stack slices through the length of the region between photobleached markers. Both relative volume (d) and relative cross-sectional area (e) decreased with increasing stretch for both 2 and gels. The dashed lines represent expected relative volume and cross-sectional area for an incompressible material.